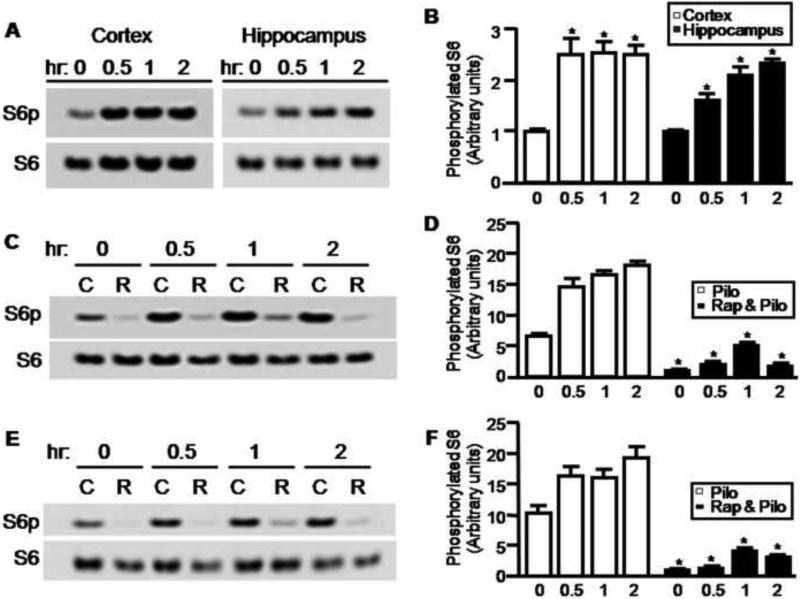
Figure 1.
Activation of mTOR by pilocarpine-induced seizures. (A) Rats received pilocarpine 300 mg/kg i.p. Brian cortical and hippocampal tissues were harvested either before or 0.5, 1, 2 hr after pilocarpine injection. Phosphorylated S6 was visualized by western blot using a phospho-specific antibody. Blots for total S6 were used as a loading control. Phosphorylated S6 was quantified by densitometry (1 ± 0.01; 2.45 ± 0.3; 2.52 ± 0.2; and 2.48 ± 0.2 in cortex; 1 ± 0.01; 1.61 ± 0.12; 2.08 ± 0.15; and 2.31 ± 0.15 in hippocampus for before or 0.5, 1, 2 hr after pilocarpine injection respectively) (B). Rats were pretreated with rapamycin 5 mg/kg for 3 days and then treated with pilocarpine for 0.5, 1 and 2 hr as indicated. Phosphorylated S6 and total S6 in rat cortex (C) and hippocampus (E) were visualized by western blots and quantified by densitometry (D & F) (pilocarpine: 6.5 ± 0.17; 14.54 ± 1.34; 16.57 ± 0.5; and 18.05 ± 0.78; rapamycin & pilocarpine: 1 ± 0.05; 2.04 ± 0.09; 4.98 ± 0.27; and 1.64 ± 0.21, in cortex for before and 0.5, 1, and 2hr after pilocarpine injection respectively) (pilocarpine: 10.21 ± 1.38; 16.27 ± 1.57; 16.1 ± 1.28; and 19.37 ± 1.71; rapamycin & pilocarpine: 1 ± 0.05; 1.32 ± 0.04; 4.13 ± 0.43; and 3.07 ± 0.17, in hippocampus for before and 0.5, 1, and 2hr after pilocarpine injection respectively)(*P < 0.05, t-test).

