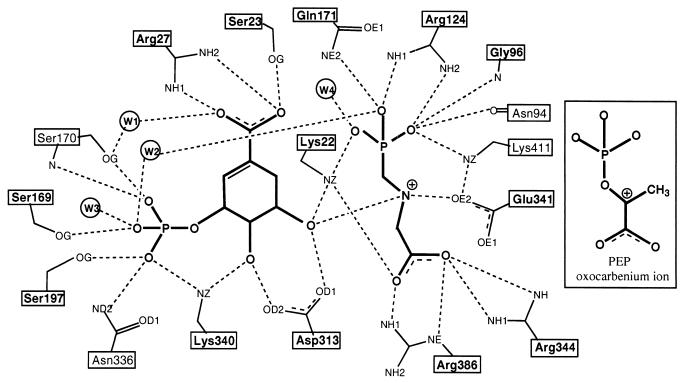
Figure 3.
Schematic representation of ligand binding in the EPSP synthase⋅S3P⋅glyphosate complex. Ligands are drawn in bold lines. Dashed lines indicate hydrogen bonds and ionic interactions. Strictly conserved residues are highlighted by bold labels. Protein atoms are labeled according to the Protein Data Bank nomenclature. Circled labels W1 to W4 designate solvent molecules. Hydrophobic interactions between S3P and Tyr-200 are omitted.

