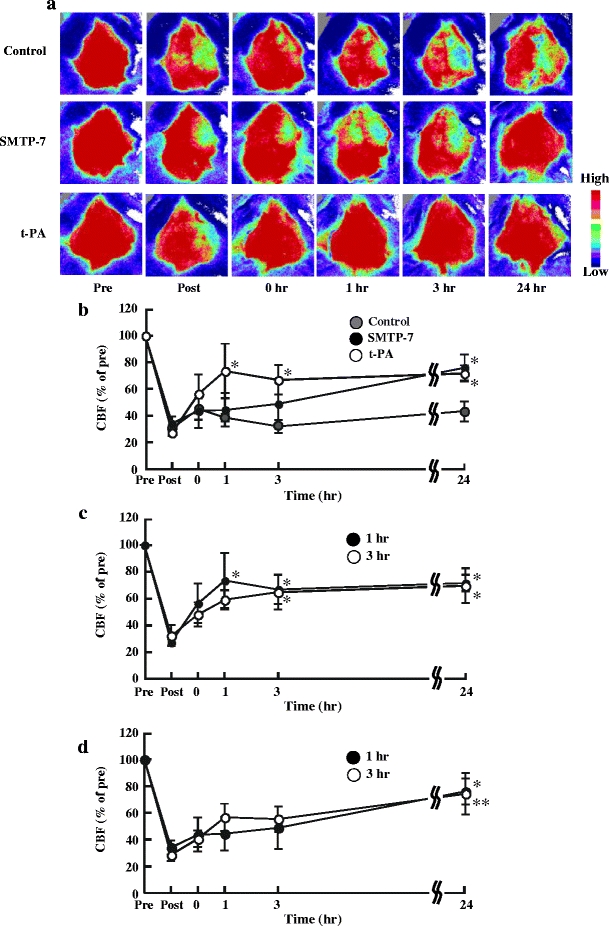
Fig. 6.

Change in CBF in embolic infarction model over time. a Pseudocolor images of cerebral tissue. Color bar indicates CBF. b Change in CBF over time. SMTP-7 and t-PA were administered at 1 h after ischemia. c Comparison of change in CBF over time. The t-PA was administered at 1 or 3 h after ischemia. d Comparison of change in CBF over time. SMTP-7 was administered at 1 or 3 h after ischemia. CBF was measured before embolic infarction (pre, 100% baseline), after embolic infarction (post), and at 0, 1, 3, and 24 h after administration. CBF was expressed as a percentage of the pre-ischemic value. Data represent the mean ± SEM of three experiments. *P < 0.05, **P < 0.01, statistically significant difference from each post value
