Figure 1.
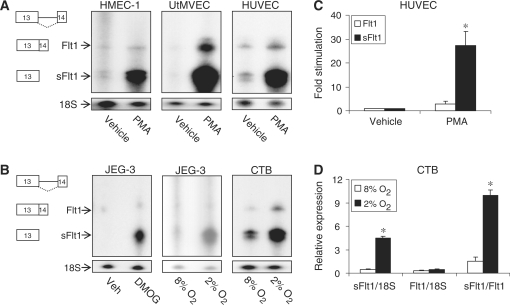
Differential regulation of sFlt1 and Flt1 transcripts in vascular endothelial cells and trophoblasts determined by RPA and qRT–PCR. An Flt1 cDNA used as template to construct a cRNA probe detects both intronic sFlt1 and spliced Flt1 simultaneously. An 18S rRNA probe is used as a loading control for RPA. (A) RPA demonstrating that PMA treatment differentially increases intronic sFlt1 mRNA in HMEC-1, UtMVEC and HUVEC. (B) Aggregate data from several experiments demonstrating that PMA stimulates sFlt1 expression to a greater extent than Flt1 in HUVEC. n = 4 ± SEM, *P < 0.01 compared to Flt1. (C) RPA demonstrates that DMOG or hypoxia (2% O2) stimulates intronic sFlt1 expression to a greater extent than Flt1 in JEG-3 cells and CTB. (D) qRT–PCR confirms that hypoxia (2% O2) stimulates sFlt1 expression to a greater extent than Flt1 in CTB. n = 3 ± SEM, *P < 0.001 compared to corresponding 8% O2 value.

