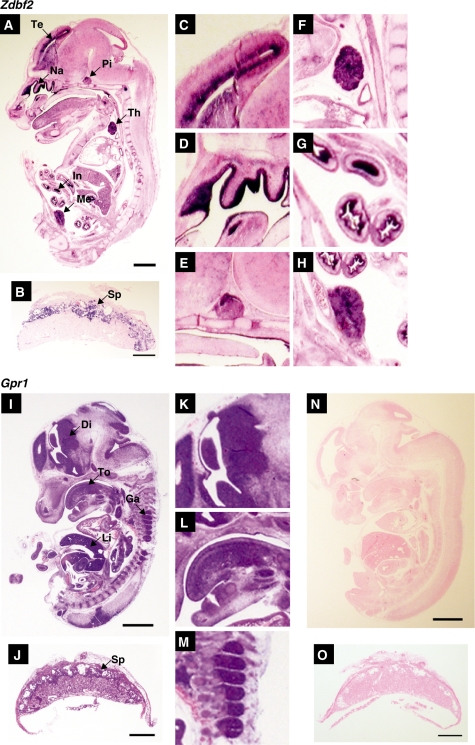
Figure 5.
Expression of mouse Zdbf2 and Gpr1. The expression of Zdbf2 and Gpr1 were examined in sagittal sections of E13.5 embryo (A and I) and placenta (B and J) by in situ hybridization. Telencephalon: Te (C), nasal epithelium: Na (D), pituitary gland: Pi (E), thymus: Th (F), intestinal epithelium: In (G), mesonephrum: Me (H), the spongiotrophoblast layer of the placenta: Sp (B), diencephalon: Di (K), tongue: To (L), dorsal root ganglion: Ga (M), liver and the spongiotrophoblast layer of the placenta: Sp (J). No signal was seen with the Gpr1 sense probe (N and O). Scale bars indicate 1 mm.

