
Figure 5.
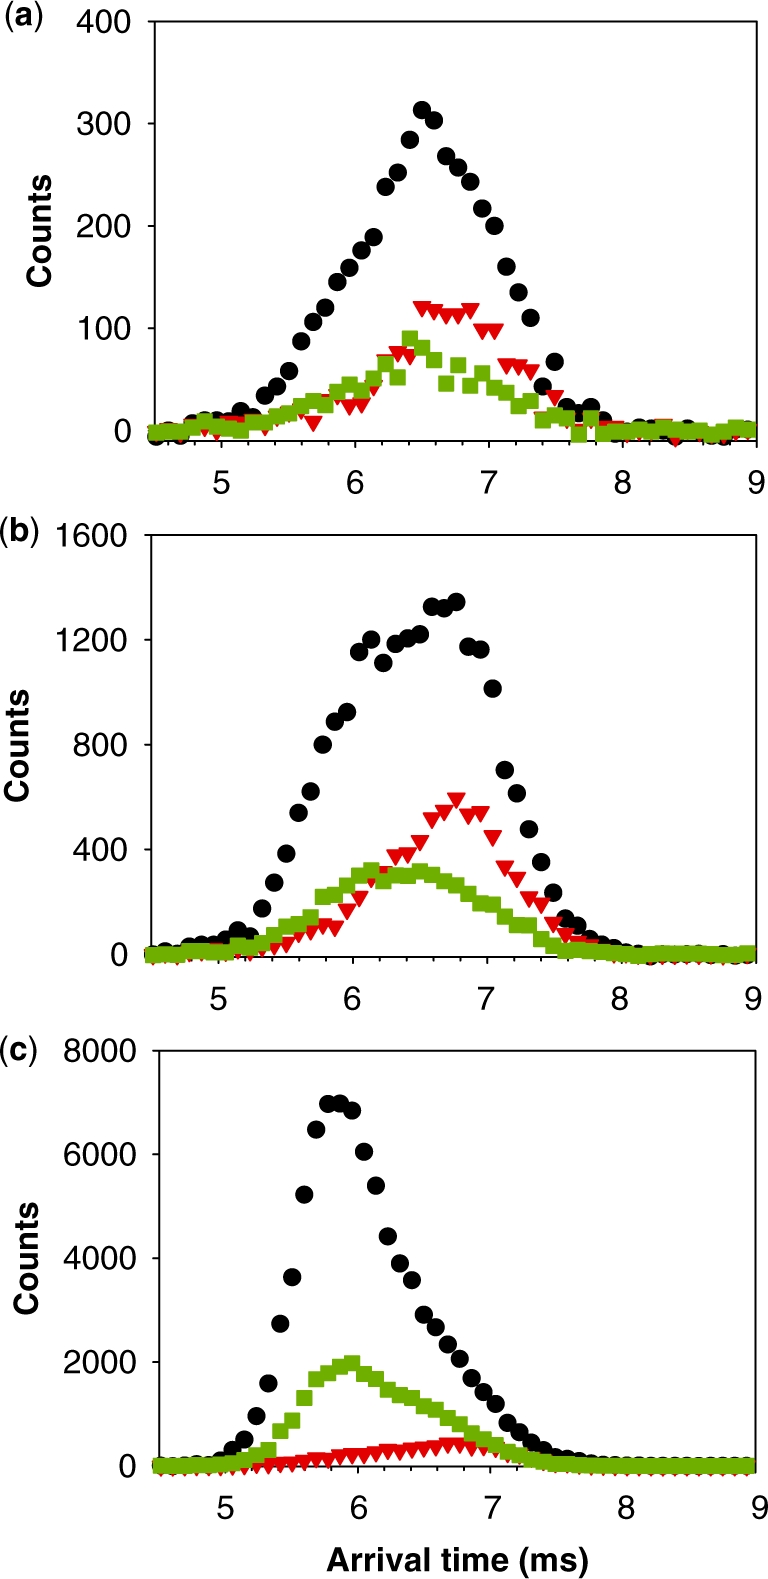
Ion mobility spectrometry of the tetramer formed from 80 µM TG5T in 20% MeOH and 150 mM NH4OAc after (a) 10 min, (b) 2 h and (c) 4 months. Red triangles, arrival time distribution of  − (m/z = 1762–1765). Green squares, arrival time distribution of
  − (m/z = 1765–1768). Black circles, arrival time distribution of the sum of all G-quadruplex adduct forms (m/z = 1762–1775). Shorter arrival times indicate more compact conformation.