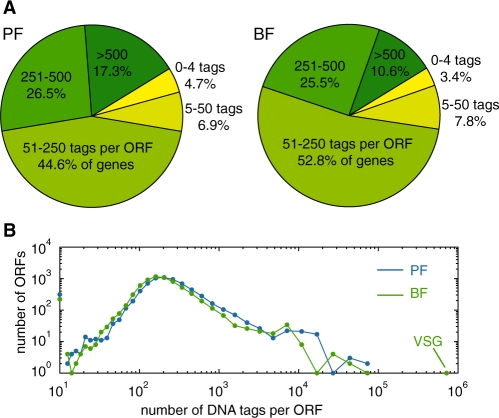
Figure 2.
Distribution of transcripts by tag abundance. (A) Transcript levels were determined for 6798 (BF) or 6840 (PF) ORFs and grouped by the number of unique sequence tags per ORF. ‘Gene groups’ of paralogous genes are counted as one ORF. For 229 (BF) or 322 (PF) ORFs we identified less than five combined unique and non-unique sequence tags. Not included in the graph are 555 (BF) and 513 (PF) ORFs for which the number of non-unique sequence tags was >20% of the unique sequence tags, and 1058 ORFs shorter than 400 bp. All remaining ORFs were grouped based on the number of unique sequence tags per ORF. (B) Distribution of tag abundance by ORF. Only one copy of a gene is included per gene family, n = 6798 (BF) or 6840 (PF). Sequence tags aligning to the first or last 150 bp of each ORF are not counted. ORFs shorter than 400 bp and ORFs for which the number of non-unique sequence tags was more than 20% of the unique sequence tags were omitted.

