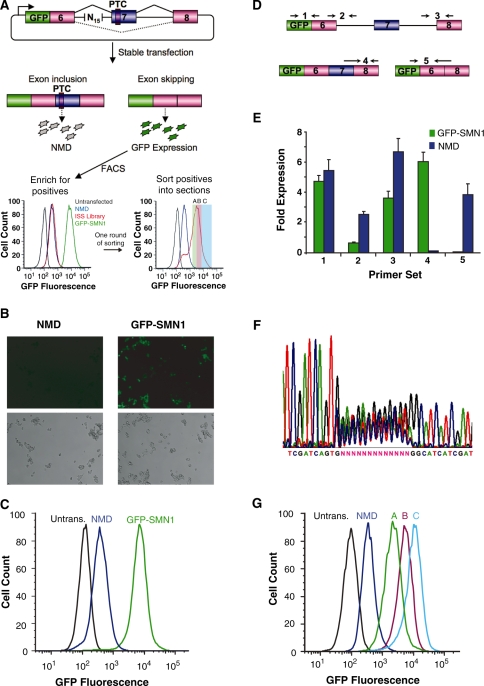
Figure 1.
A Screening PLatform for Intronic Control Elements (SPLICE) provides a generalizable in vivo screening strategy for ISREs. (A) SPLICE couples an exon inclusion event in a mini-gene (SMN1) to the expression level of a fluorescent protein (GFP) through a NMD-based reporter system. A random nucleotide library cloned upstream of the 3′ ss is screened for ISREs by sorting cells based on fluorescence levels. The enriched cells are sorted into sections (A, B, C) in a second screening round. (B) Microscope images of stable cell lines expressing the negative (NMD) and positive (GFP-SMN1) control constructs. (Upper panels) GFP fluorescence, lower panels: phase contrast images. (C) Flow cytometry histograms of stable cell lines expressing the control constructs. An untransfected HEK-293 FLP-In cell population (Untrans.) was also analyzed for reference. (D) Schematic representing the relative locations of primer set binding for transcript isoform analysis by qRT-PCR. Primer sets were used to quantify levels of total transcript (set 1), intron 6 retention (set 2), intron 7 retention (set 3), exon 7 included isoform (set 4) and exon excluded isoform (set 5). Primer binding locations within the SMN1 mini-gene are presented in Supplementary Figure S3. (E) qRT-PCR analysis of the NMD and GFP-SMN1 control cell lines supports decay of the PTC harboring isoform. Expression levels were normalized to the levels of HPRT (hypoxanthine-guanine phosphoribosyltransferase). Data presented is the mean expression of duplicate PCR samples ± the average error. (F) DNA sequencing analysis of purified genomic DNA from HEK-293 cell lines harboring the library constructs. (G) The enriched cell populations maintain the fluorescence levels of the sorted sections (A, B, C). Following the second round of sorting, the fluorescence levels of expanded populations were re-analyzed through flow cytometry to confirm maintenance of expression levels.

