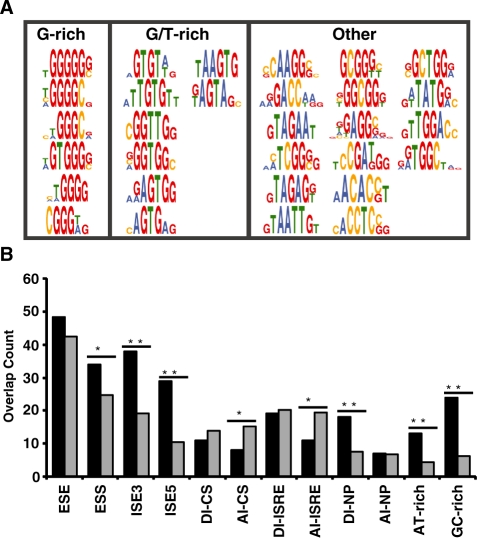
Figure 3.
Enriched motifs derived from recovered ISRE sequences map to known and unknown splicing factors and overlap with SREs. (A) Motifs are grouped into three classes: G-rich, GT-rich and other elements (classes 1–3, respectively). (B) Observed (black) and expected overlap (gray) between data sets. The set of pentamers enriched in the ISRE sequences were compared to previously compiled lists of ESEs (15,16), ESSs (14,16), ISEs (32) ISREs (33), CISs (30), motifs enriched upstream of weak PY tracts (34) and motifs enriched in intronic regions of exons excluded in NP cells (35). P-values derived from the chi-squared test of association are as follows: *P < 0.05 and **P < 0.0001.

