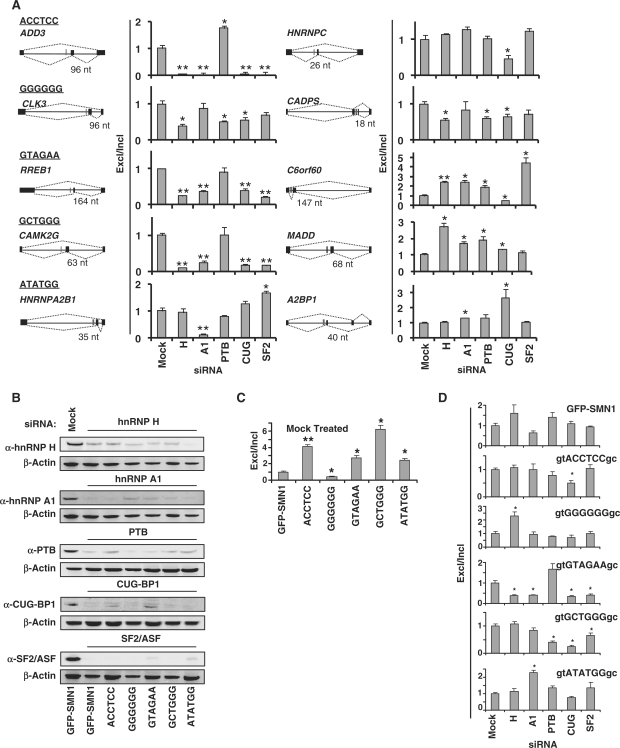
Figure 5.
The effects of in vivo depletion of splicing factors on the splicing patterns of endogenous and synthetic genes containing conserved intronic hexamers. (A) qRT-PCR analysis of the siRNA treated GFP-SMN1 control cell lines with primer sets specific for exon included (primer set 4, Figure 1D) and excluded (primer set 5) products of 10 endogenous genes. The splicing patterns of each gene are diagrammed where black bars represent exons and red bars represent the location of conserved ISRE hexamer motifs. Data is reported as the ratio of the mean expression of the exon excluded isoform to the exon included isoform normalized to the ratio for the GFP-SMN1 control ± the average error. P-values derived from the Student's t-test are as follows: *P < 0.05 and **P < 0.01. (B) Western blot analysis of total cell lysates prepared from the GFP-SMN1 control and ISRE hexamer cell lines treated with siRNAs targeted to trans-acting splicing factors and a mock siRNA negative control. β-Actin was used as a loading control for all blots. The results of the GFP-SMN1 mock treated lysate is representative of all mock-treated cell lines. (C) qRT-PCR analysis of the mock-treated ISRE hexamer and GFP-SMN1 control cell lines with primer sets specific for exon 7 included (primer set 4) and excluded (primer set 5) products. Data is reported as the ratio of the mean expression of the exon excluded isoform to the exon included isoform normalized to the ratio for the GFP-SMN1 control ± the average error. (D) qRT-PCR analysis of the siRNA treated ISRE hexamer and GFP-SMN1 control cell lines with primer sets specific for exon 7 included and excluded products (primer sets 4 and 5, respectively). Data is reported as the ratio of the mean expression of the exon excluded isoform to the exon included isoform normalized to the ratio for the mock siRNA treated cell line control ± the average error.

