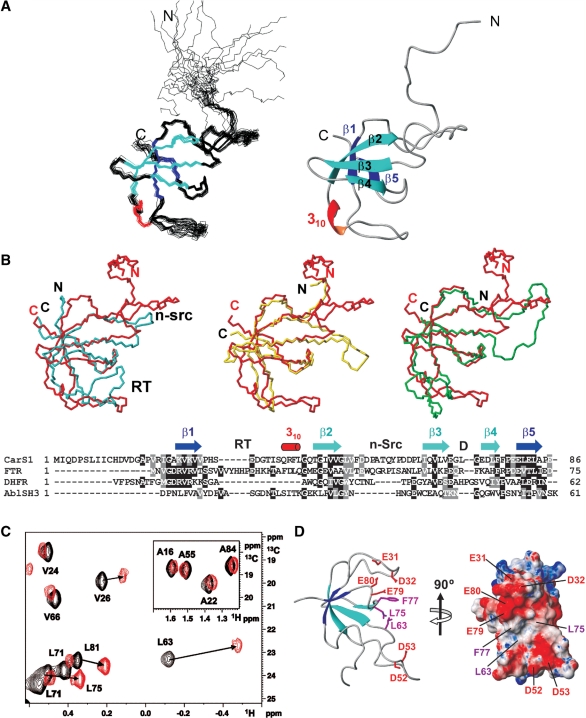
Figure 1.
CarS1 structure and interactions with CarANt from NMR. (A) Superposition of the backbone traces for the 20 final NMR structures (left) and ribbon diagram of the average structure. (B) Cα-based overlay of the Abl tyrosine kinase SH3 domain (blue; PDB ID: 1JU5), R67-plasmid DHFR (yellow; PDB ID: 1VIE), or chloroplast FTR subunit B (green; PDB ID: 1DJ7) onto CarS1 (red). The respective DALI Z-score/rmsd (Å)/sequence identity (%)/number of superimposed residues are: Abl SH3 domain: 3.4/2.6/6/50; DHFR: 5/1.6/20/49; FTR B: 5.2/2.7/21/57. Below is a structure-based sequence alignment showing secondary structural elements and the RT, n-Src and distal (D) loops as denoted in SH3 domains. Residues are shaded black if identical in at least two sequences and gray if similar. (C) Portion of the 1H-13C HSQC spectrum of 13C, 15N-labeled H6CarS1 (0.24 mM) showing methyl crosspeaks perturbed by a 1.5-fold excess of unlabeled CarANt (red) compared to no CarANt added (black). Inset shows negligible perturbation of labeled Ala methyl crosspeaks for comparison. (D) Ribbon and electrostatic surface models of CarS1 showing residues that interact with CarANt from NMR data. Interacting side chains are depicted as magenta sticks with neighbouring acidic residues in red in the ribbon model.

