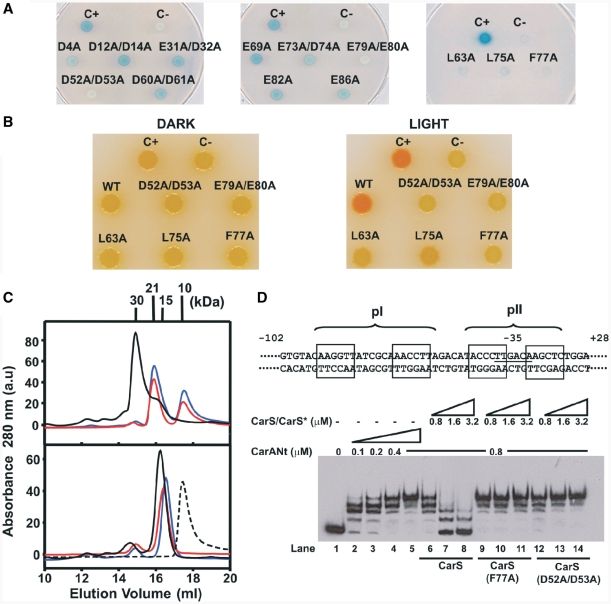
Figure 2.
CarS residues interacting with CarA identified by site-directed mutagenesis. (A) Yeast two-hybrid analysis of the interactions of each CarS mutant (CarS*) with CarA on glucose plates. C+: LexA–CarA and B42–CarS; C−: LexA–CarA only; others: LexA–CarA and the indicated B42–CarS*. (B) Color phenotypes for carotenogenesis in M. xanthus strains bearing the indicated carS allele. C+: wild-type; C−: ΔcarS; others are derived from introducing the indicated allele into the ΔcarS strain. (C) Elution profiles off a Superdex-200 analytical gel filtration column for the pure proteins (bottom) and CarANt mixed with CarS or CarS* (top). Dashed line is for pure CarANt; black, blue and red lines are for CarS, CarS* (F77A) and CarS* (D52A/D53A), respectively, with or without CarANt. Mr (in kDa) for each peak maximum is shown. (D) Top: schematic of the 130-bp EMSA probe spanning the carB promoter region, relative to the transcription start site (+1). The operator pI (–64 to −47) and pII (−40 to −26) sites are shown with their palindromic halves boxed. Bottom: EMSA for CarANt-binding to the 130-bp probe alone (lanes 2–5) or with increasing levels of CarS or CarS* added, as indicated.

