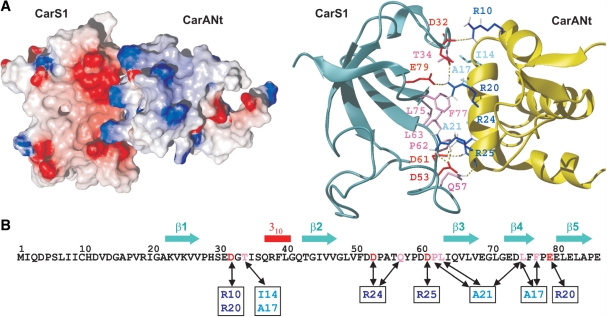
Figure 5.
Model of the CarS1–CarANt complex. (A) Electrostatic surface and ribbon representations of CarS1–CarANt complex illustrating charge and shape complementarity of the interacting surfaces. In the ribbon model, side chains at the interface are depicted as sticks in red (E or D) or pink (uncharged residues) for CarS1, and dark (R) or pale blue (uncharged) for CarANt. Dotted lines are possible H-bonds. (B) CarS1 sequence with residues interacting with those in CarANt (boxed) linked by double-headed arrows and colored as in (A).

