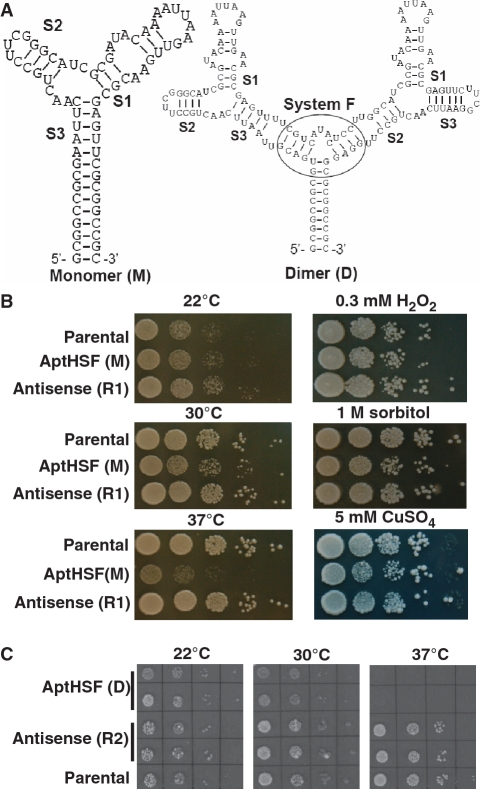
Figure 3.
Cellular phenotype of the inhibitory HSF aptamer. (A) Predicted secondary structure of the monomer and the dimer being expressed in yeast. The sequence between the two ClaI sites is shown. Different stems are indicated. The additional three-way junction used to present the dimer is encircled. (B) Growth of the monomer (M)-expressing strain and control strains cultured on different solid media and under different temperatures. ‘Antisense (R1)’ is a strain in which the antisense sequence of the monomer was expressed. (C) Growth of the dimer (D)-expressing strain and control strains cultured under different temperatures. ‘Antisense (R2)’ is a strain in which the antisense sequence of the dimer was expressed. In both (B) and (C), the parental strain was W303-1A. Patches in both (B) and (C) were inoculated by 10-fold serial dilutions of yeast stock.

