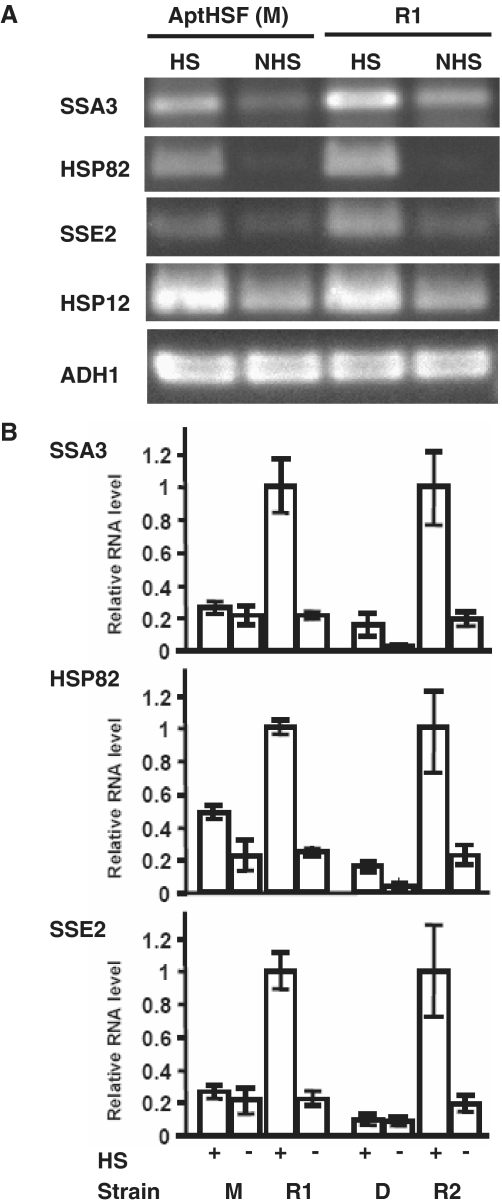
Figure 4.
Molecular phenotype of the inhibitory HSF aptamer. (A) Effect of aptamer monomer (M) on the level of HS genes measured by conventional RT–PCR. ‘R1’ is a strain expressing the antisense sequence of the aptamer monomer. HS (20 min at 39°C). (B) Effect of both aptamer monomer (M) and dimer (D) on the level of HS genes measured by RT–qPCR. ‘R2’ is a strain expressing the antisense sequence of the aptamer dimer. The RNA level for each gene is presented as the ratio to the full HS induction level in the antisense control strain, which is set to 1. The expression level for each gene is normalized to that of ADH1. (We also used U6 to normalize the data, and the data sets were consistent with each other.) The error bars show the standard error from RT–qPCR experiments using three independently heat-shocked yeast RNA preparations from the same strain. In both panels the parental strain used was W303-1A.

