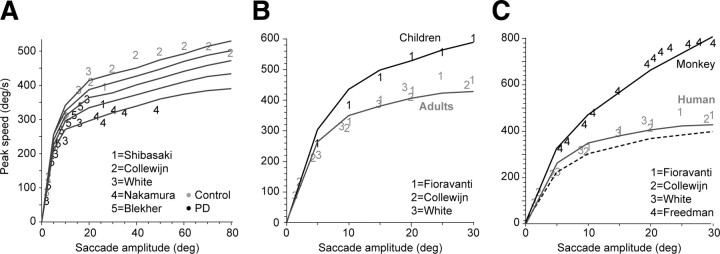
Figure 3.
Change in the reward discount function predicts change in saccade velocities. The lines are simulation results, and the numbers refer to data from previous publications. For each line, the stimulus value α was kept constant. A, Saccade velocities in Parkinson's disease and healthy controls from data in the studies by Shibasaki et al. (1979), Collewijn et al. (1988), White et al. (1983), Blekher et al. (2000), and Nakamura et al. (1991). Reducing the stimulus value decreases saccade speeds. The changes in saccade speeds are bigger for large-amplitude saccades than small amplitudes. Parameter values are as follows: α = 0.52 × 10⁴ to 1.08 × 10⁴ and β = 2.5. B, Saccade velocities in children and young adults. Increasing the rate of discounting of reward (α in Eq. 6) by a factor of 2 produces saccade velocities that are similar to those seen in children. The data are from the studies by Fioravanti et al. (1995), Collewijn et al. (1988), and White et al. (1983). Parameter values are as follows: children, α = 2.16 × 10⁴; adults, α = 1.08 × 10⁴, β = 2.5. C, Saccade velocities in adult humans and rhesus monkeys. The dashed line represents simulations for which a rhesus monkey eye plant was combined with a human temporal discount function. The black line represents simulations for which a monkey eye plant was combined with a monkey temporal discount function (α = 6.5 × 10⁴). For the human simulations, α = 1.08 × 10⁴. The data on monkey saccades are from the study by Freedman (2008).

