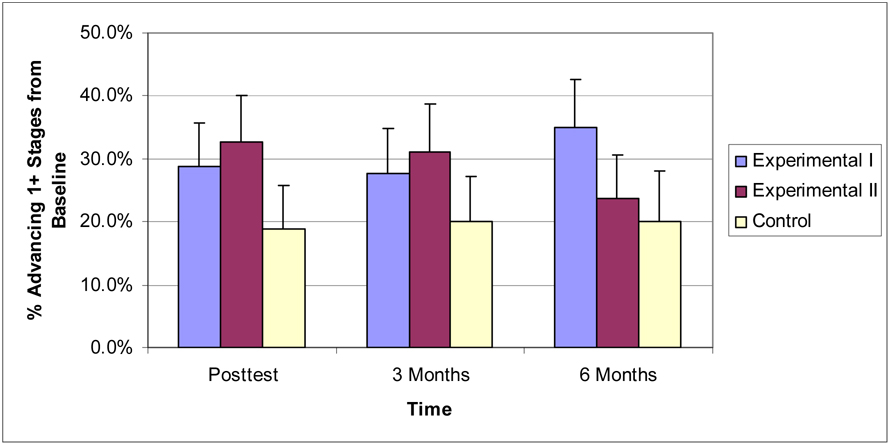
Figure 3.
Percent advancing one or more stages compared with baseline on Fats Stages of Change. Error bars represent the upper limit of the 95% CI. Data were collected in 2005–06 at Northeastern University, College of Charleston, Florida Atlantic University, University of Missouri - St. Louis and Columbia campuses, and Florida International University.

