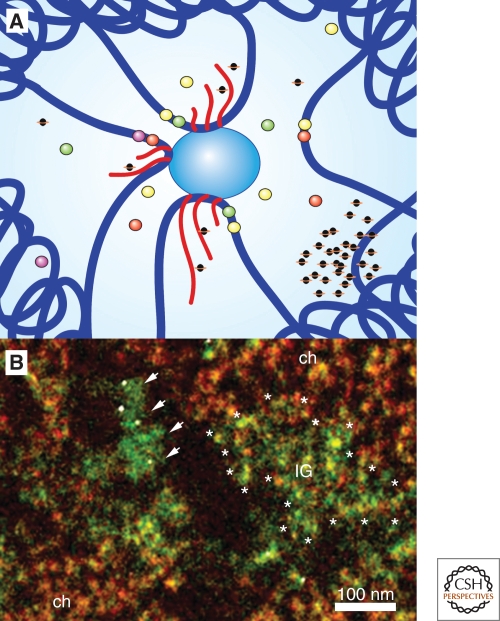
Figure 1.
(A) Schematic diagram of transcription of multiple genes at a nuclear RNAPII transcription factory. RNAPII factory shown as central blue circle with three transcribing genes and their associated transcription factors (small colored circles). Nascent transcripts are shown in red, chromatin is dark blue, and splicing components are depicted as small black circles with orange halo. (B) Electron spectroscopic imaging of HeLa cell nucleus. Phosphorous-rich structures are colored red and nitrogen green. Arrows point to nitrogen-rich transcription factory. White dots are immunogold detection of BrdU pulse-labeled nascent transcripts. Asterisks outline a small region of interchromatin granules (IG) and ch denotes regions of relatively compact chromatin. Image courtesy of Dr. Christopher Eskiw.

