
FIGURE. Kaplan-Meier survival curves.
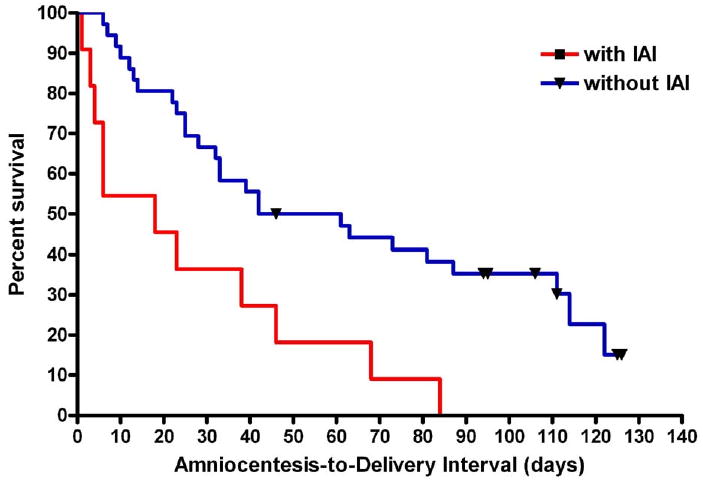
Kaplan-Meier survival curves of patients with a negative amniotic fluid culture, with and without intraamniotic inflammation (IAI). One patient was censored at 32 weeks because of loss to follow-up, and all other patients were censored at 37 completed weeks of gestation (black symbols at censored observations). The 2 curves differed significantly (log rank, P = .0018)