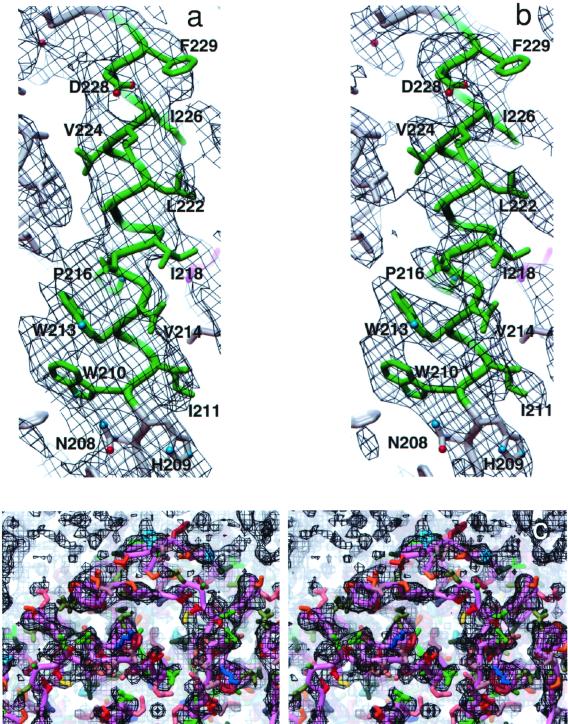
Figure 2.
A representative section defining the density for TM6 in the (a) experimental and (the corresponding) (b) calculated 2Fo−Fc map (Materials and Methods). (c) A stereo pair of the experimental 3-D density maps viewed normal to the bilayer from the extracellular side, and overlaid with the polypeptide model. The polypeptide backbone is shown in purple with the hydrophobic groups, groups with formal positive and negative charge, and aromatic side chains indicated with the colors green, blue, red, and brown, respectively. The depth cueing is such that the densities for the extracellular interhelix loops are primarily accentuated. Densities for one monomer and parts of adjacent monomers around the 4-fold axis are shown. The maps in this and in the other figures were rendered at 1.0σ of the mean density. Figures were generated by using the avs software (46).

