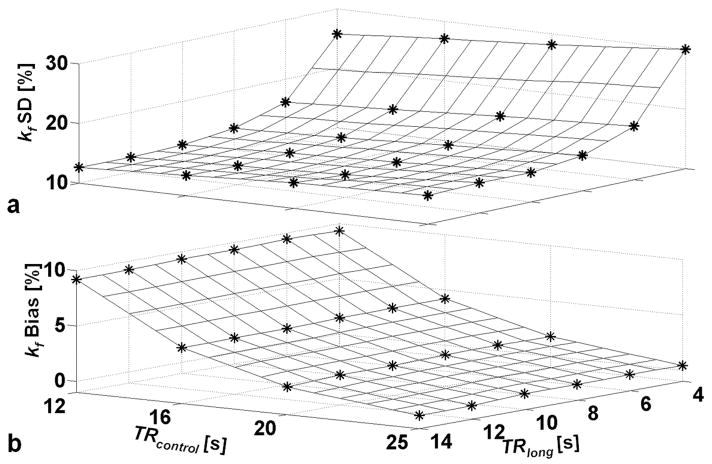
Figure 3.
Results from the Monte Carlo simulations of the TRiST experiment averaged over the kf range 0.1 to 0.4s−1 as a function of TRlong (with γ-ATP saturated) and TRcontrol (control saturation). TRshort was 1.7s (γ-ATP saturated) and NA combinations were chosen for a constant total study time of 38±0.2min. (a) The relative % SD in kf for NA choices that lead to minimum error at each TRlong and TRcontrol combination. (b) The average bias error in kf, corresponding to the TRlong, TRcontrol and NA combinations in part (a). A positive bias of 4% means that the observed kf is less than the true kf by 4%.

