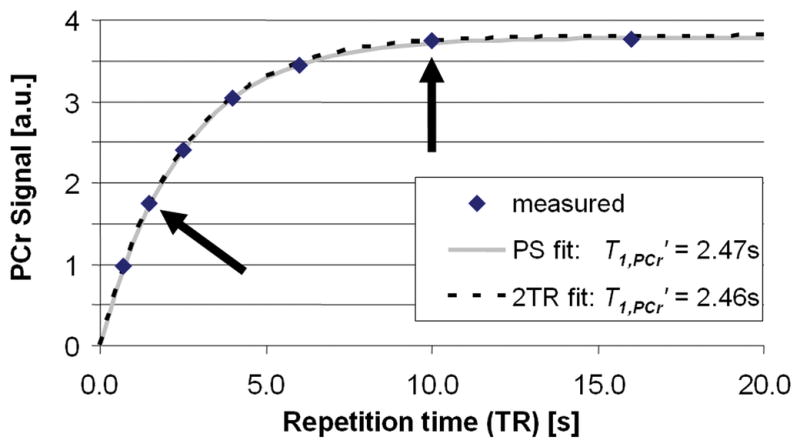
Figure 4.

Steady-state PCr signal (in arbitrary units, a.u.) measured as a function of TR (diamonds) while γ-ATP is saturated in one volunteer to determine T1,PCr′. T1,PCr′ was determined both by the conventional partial saturation by fitting all 7 data points (dotted line, relaxation curve), and by the 2TR method using only the data points acquired at TRs of 1.5s and 10s (arrows; the grey line is the corresponding implied relaxation curve).
