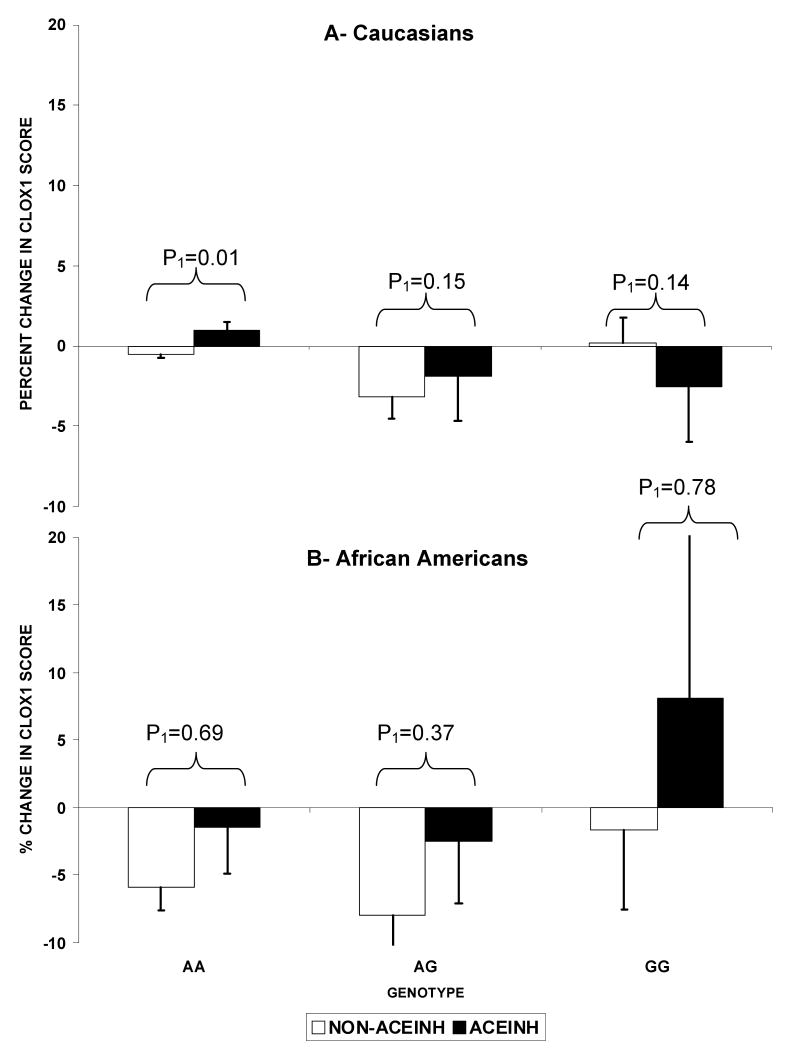
Figure 1.
Longitudinal change in CLOX1 score by AGT6 genotypes (AA, AG, GG) in the 2 ACEINH groups in Caucasians (A) and African Americans (B).
Footnote: Values are the percent change in the least square means of CLOX1 scores adjusted for baseline CLOX1, age, gender, BMI, education, systolic blood pressure, stroke, APOE, diabetes, and other antihypertensives.
*: signify that the p-value for the change within the genotype is significant (<0.01). P1 reflect the significance for the difference in change of CLOX1 scores between the ACEINH vs non-ACEINH groups (P2: excluding those with baseline low CLOX1 scores).

