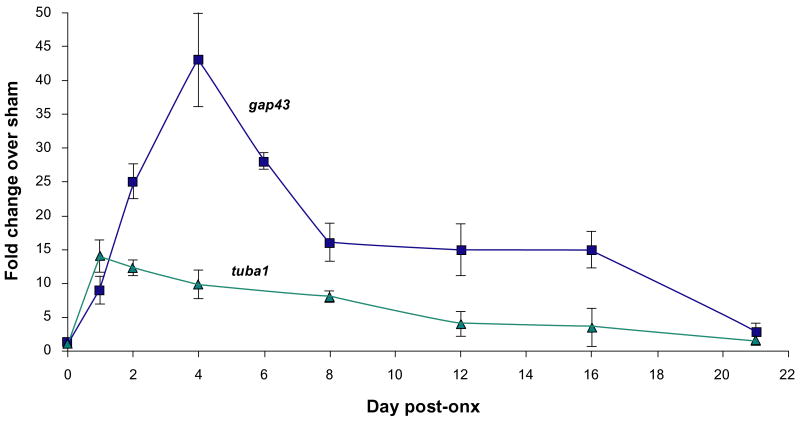
Figure 1. Expression of established gene markers of optic nerve regeneration as a function of time after ONX, as determined by qPCR analysis.
Each data point represents the mean fold change (ONX/SHAM) +/− SEM of 3 independent biological replicates. Both genes showed significant differences across regeneration stages by one-way ANOVA P < 0.05.

