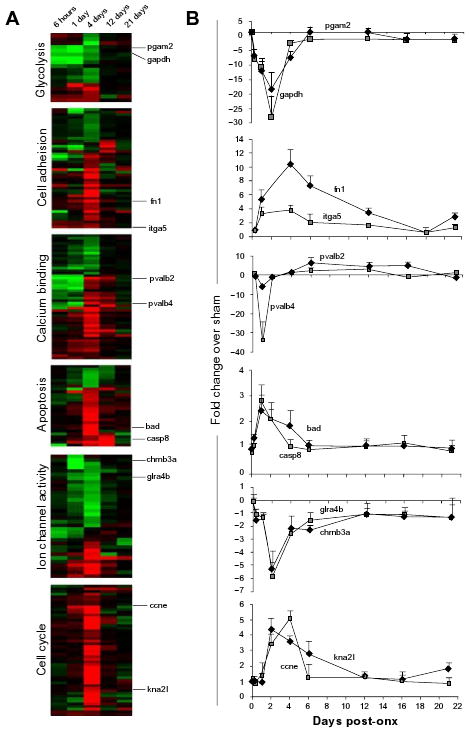
Figure 5. Cluster analysis and target gene expression.

Cluster analysis was performed on microarray data using cluster and heat maps were constructed using TreeView. Two genes from each gene ontology class were selected for qPCR analysis at nine time-points (0 hrs, 6 hrs and 1, 2, 4, 6, 12, 16 and 21 days). The results are represented as mean fold-change of ONX over SHAM. Error bars show standard error of mean (S.E.M) of biological triplicates. For expanded heat maps, see Fig. S1.
