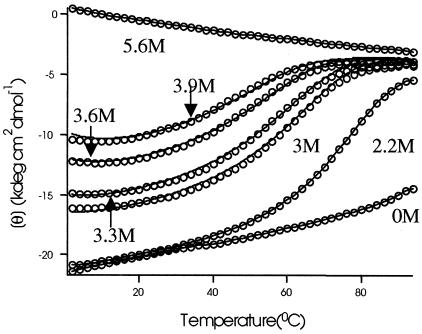
Figure 3.
Thermal denaturation of DSD. CD data monitoring the loss of helical signal at 222 nm with increasing temperature at varying concentrations of Gdn⋅HCl: 0 M, 2.19 M, 3 M, 3.3 M, 3.6 M, 3.9 M, and 5.6 M, respectively. The smooth lines represent theoretical curves obtained by using parameters from the fitting procedure (see Materials and Methods).

