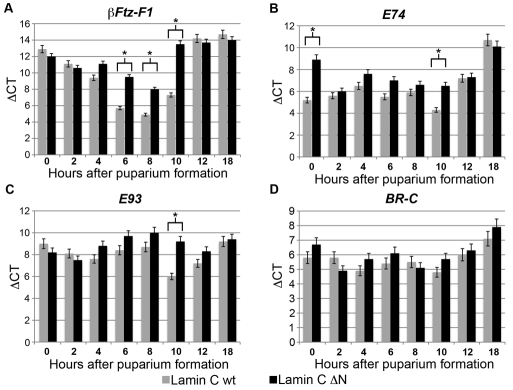
Fig. 5.
Expression of ecdysone-responsive genes in staged pupae. Quantitative RT-PCR analyses of mRNA from ecdysone-responsive genes. The y-axis indicates steady-state levels of (A) βFtz-F1,(B) E74, (C) E93 and (D) BR-C mRNA as ΔCT normalized to rp49 CT. The x-axis shows time relative to puparium formation (set at zero). Asterisk indicates P≤0.001 as calculated by an unpaired Students' t-test.

