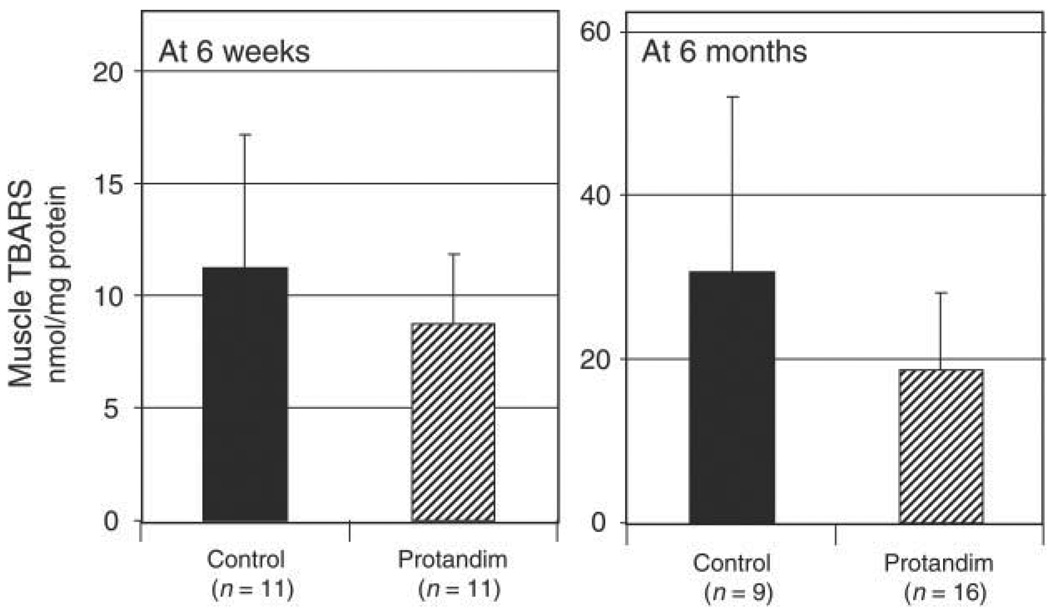
FIGURE 2.
Muscle TBARS analysis of Protandim® versus control diet fed mdx mice demonstrates that (a) average muscle TBARS after 6 weeks was lower if fed Protandim® (n = 11) (8.8 nmol/mg ± 3.1 SD) compared with control diet (n = 11) (11.4 nmol/mg ± 5.9 SD) (b) average muscle TBARS after 6 months was lower in mdx mice fed with Protandim® (n = 16) (18.4 nmol/mg ± 10.1 SD) compared with control diet (n = 9) (30.1 nmol/mg ± 21.3 SD).

