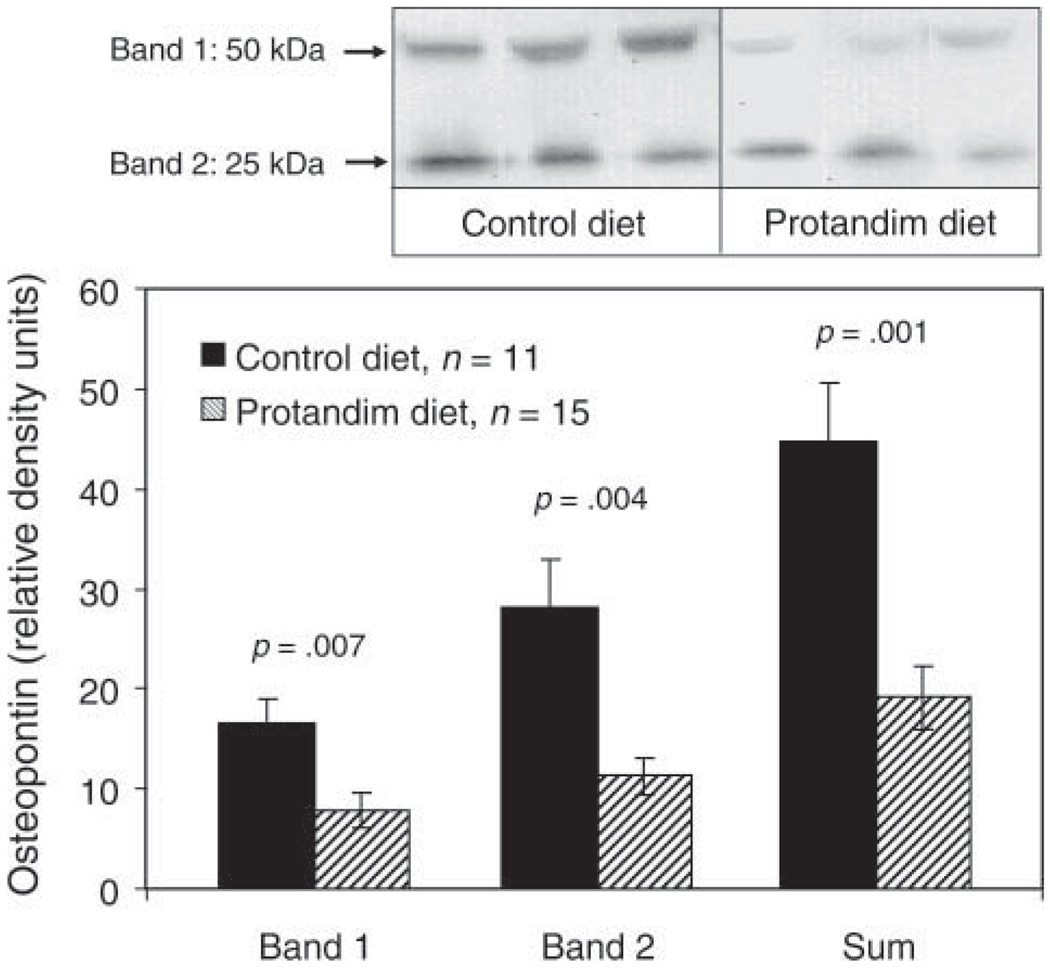
FIGURE 3.
(a) Western blot analysis for OPN in 6 month mdx mice, showing three representative animals from each group with total densities near the mean for their group. (b) The mean integrated relative densities ± SEM for the two groups are shown for each band, and for the sum of the two bands for each animal. An internal standard was used to normalize multiple blots.

