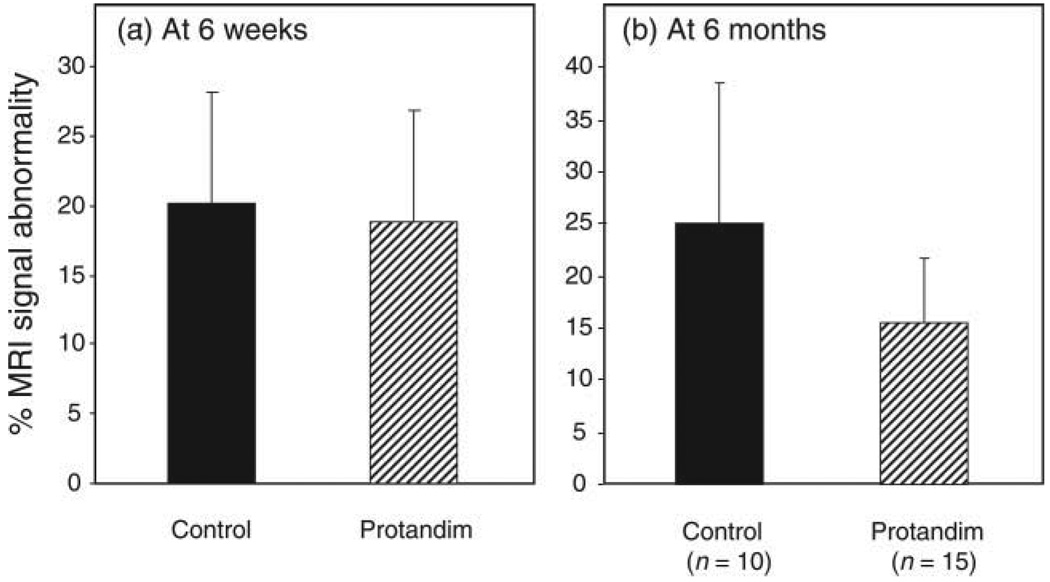
FIGURE 7.
ROI-quantitative measurement of percentage gadolinium-enhanced MRI areas in the control-fed group (25.1% ± 13.6% SD, n = 10) compared with the Protandim®-fed group (15.6% ± 6.2% SD, n = 15) at 6 months showed a mean 38% reduction in the Protandim group, but did not reach statistical significance (p = .07).

