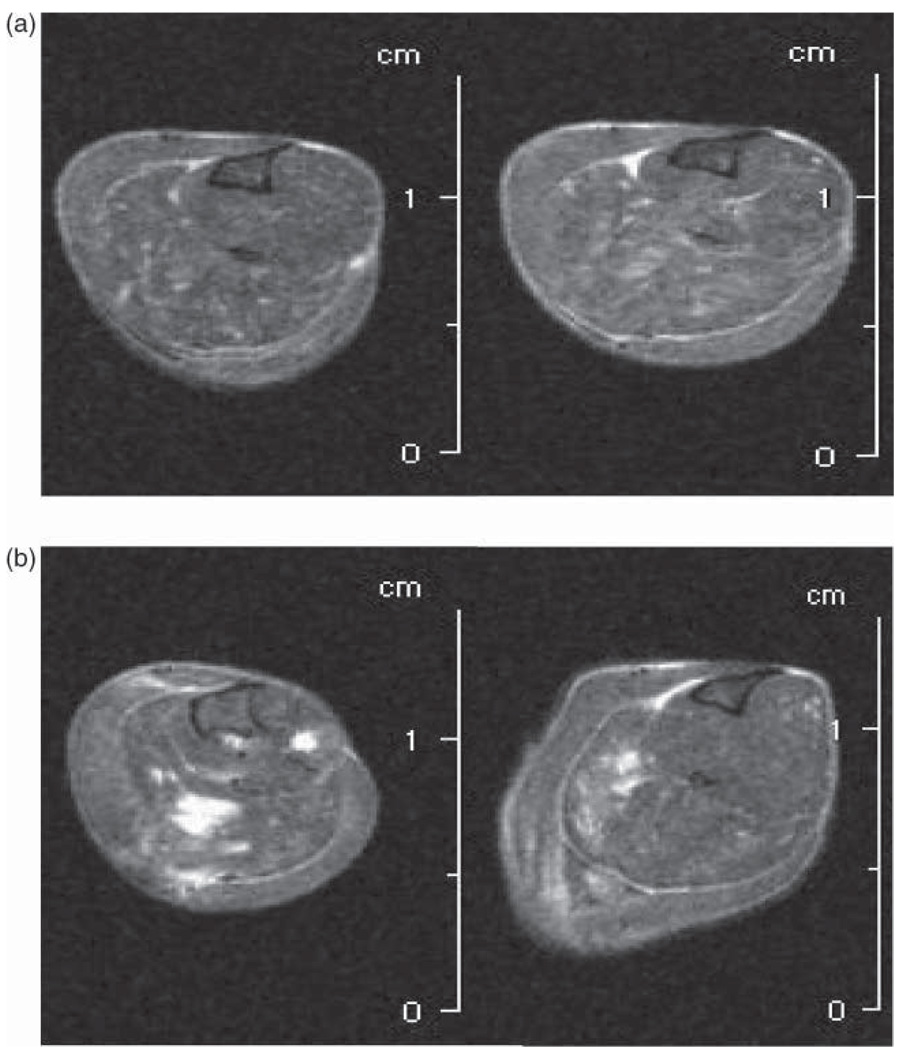
FIGURE 8.
Representative MRI muscle images in the lower leg of 2 Protandim®-diet and 2 control-diet fed mdx mice at 6 months. The brighter areas reflected distinct MRI signal contrast enhancement: black: bone cavities; white: fat and conjunctive tissues; grey:muscles. (a) No enhanced white signal is visible on cross-sections of Protandim® -fed mice, although subcutaneous fat (nonmuscle region) gives similar signal. (b) More distinct gadolinium-enhancing (white) regions are visible on the muscles on cross-sections of the control diet in mdx mice. Gadolinium-enhancing muscle regions were quantified and there was a 35% decrease after 6 months of Protandim® diet (p = .07).

