Figure 1.
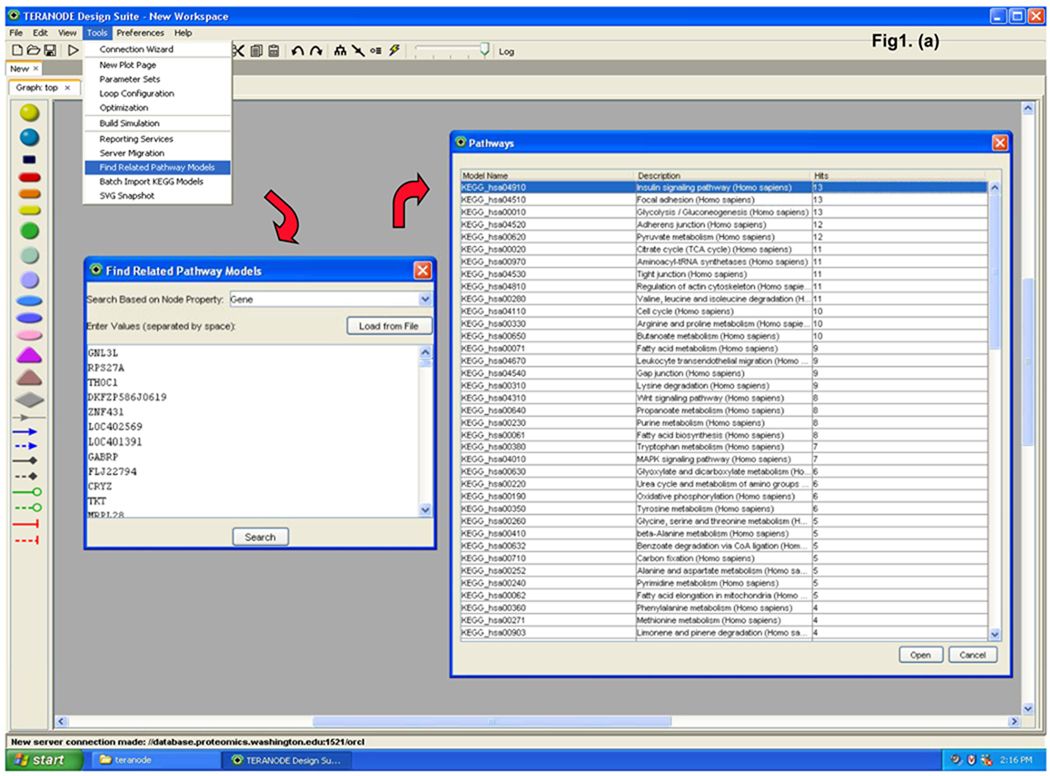
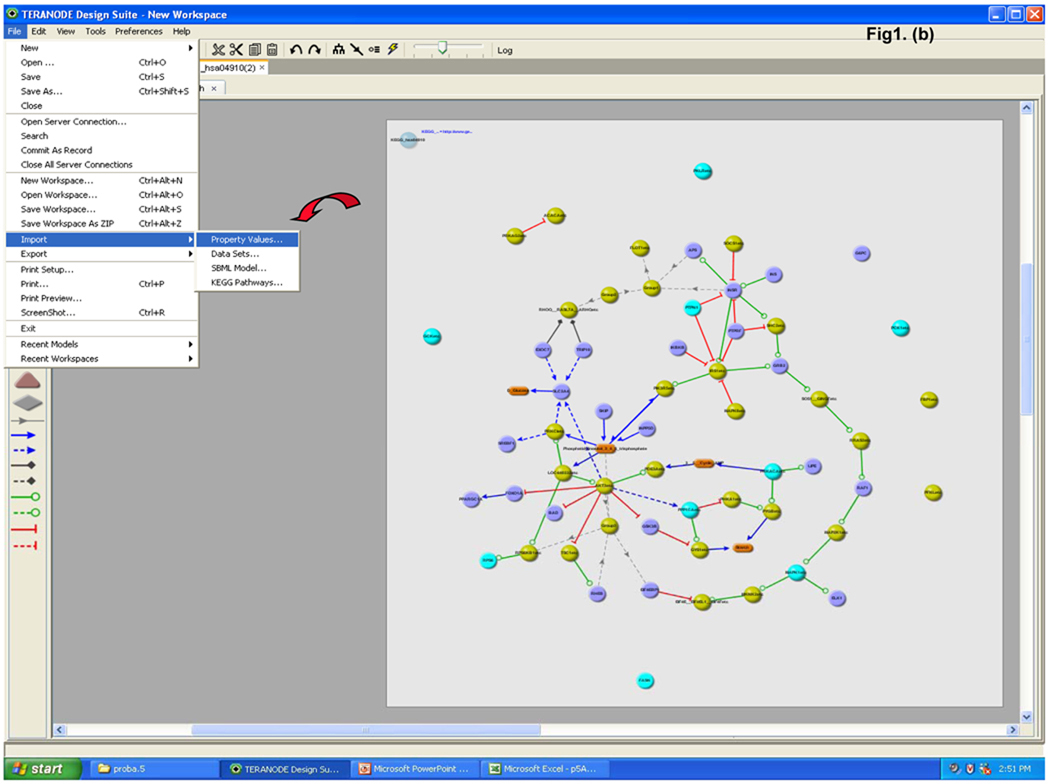
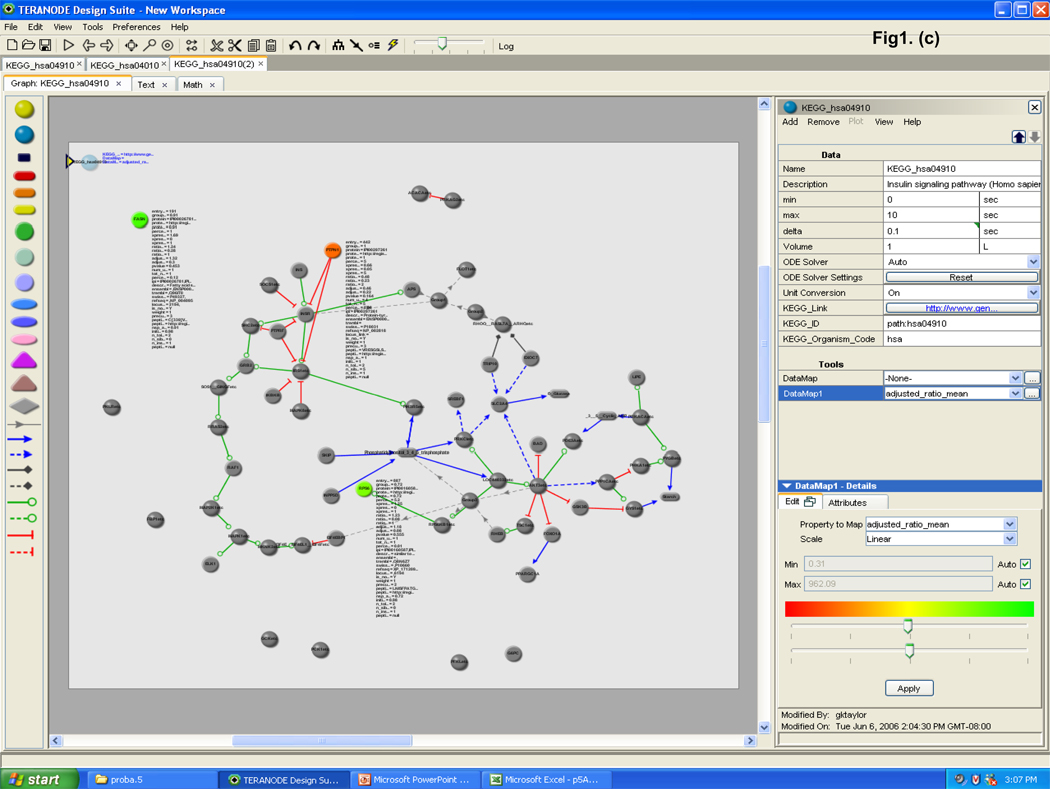
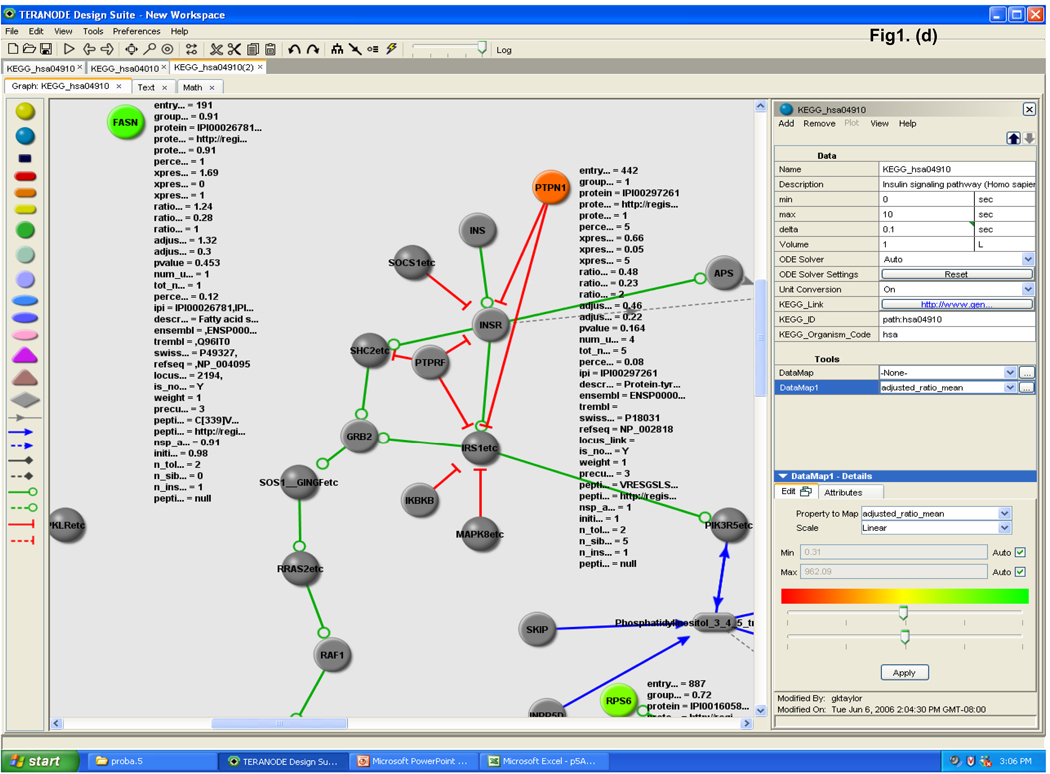
Teranode® Design Suite biological protein pathway modeling process. (a) The proteomics data are used to search against entire pathway networks available via find tools. The search is complete with the list of pathways mapped by the input proteomics data; a selected example of insulin signaling pathway is shown. (b) The insulin signaling pathway is shown on the right with nodes and edges, and the identified proteins are colored in turquoise. Property values (i.e. protein expression values) are imported via the menu system; and (c) property annotations are listed by the nodes or displayed in a separate window. Expression changes are color scaled representing reduced to induced by red to green, respectively. (d) Enlarged area view of identified proteins in the insulin signaling pathway is shown.


