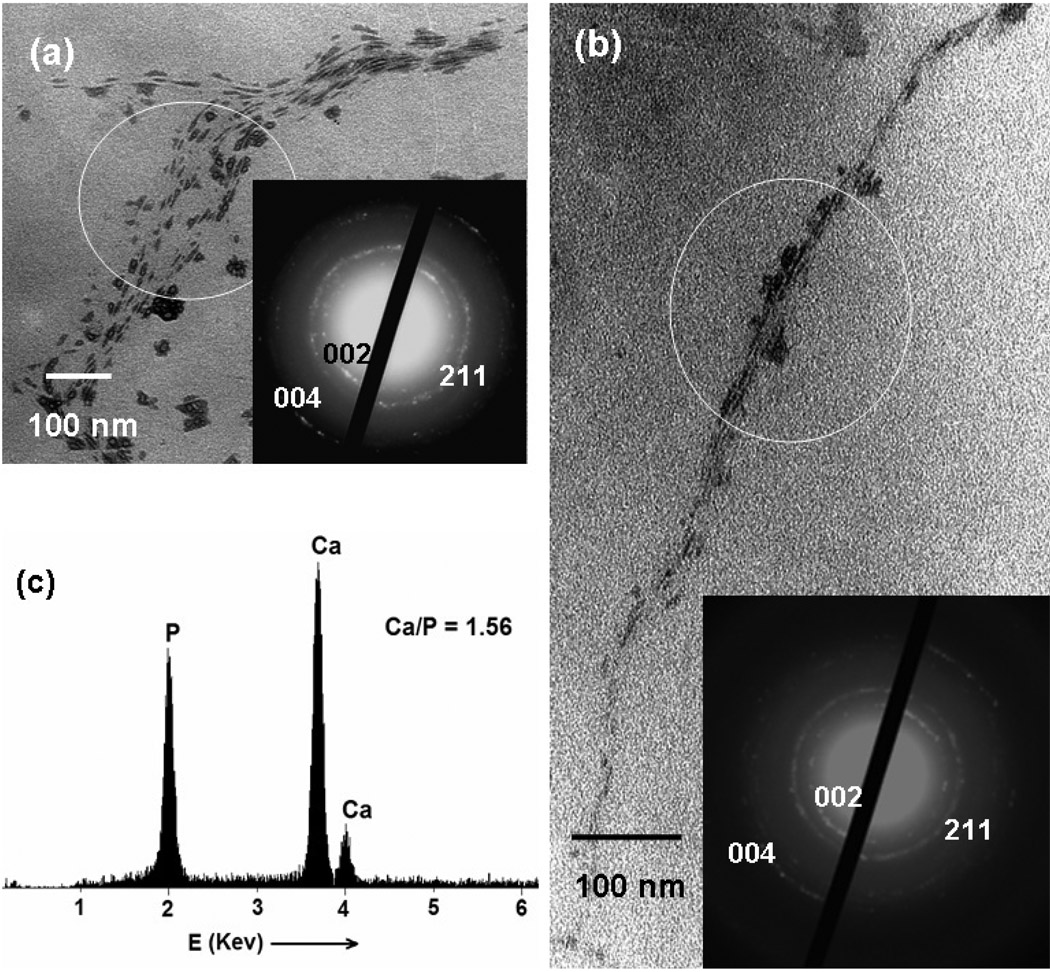
Figure 3.
TEM images and corresponding SAED patterns of HAP-phage nanocomposites. (a) wider and (b) narrower HAP-fd phage bundles. Insets are the SAED patterns taken from the highlighted sections. (c) EDS analysis of the HAP-phage bundle in (a). It should be noted that phages in these images are not visible under TEM because they are not stained.

