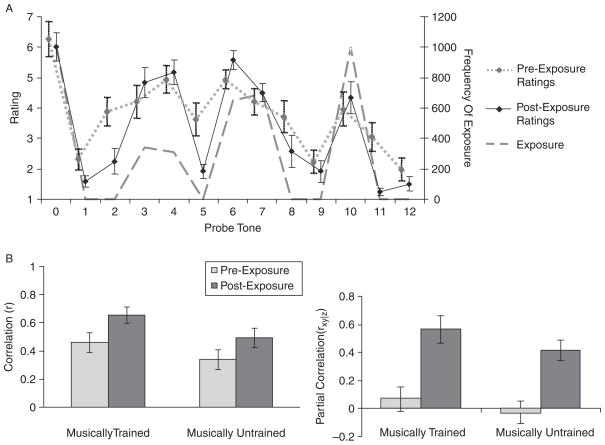
FIGURE 5.
(A) Pre- and post-exposure probe tone ratings and exposure frequencies from Experiment 2. The solid line represents post-exposure ratings, the dotted line represents pre-exposure ratings, and the dashed line represents the profile of the exposure set (exposure frequencies are plotted on the secondary y-axis). Error bars reflect between-subject standard errors. Exposure frequencies were more highly correlated with post-exposure ratings than with pre-exposure ratings, suggesting that participants became increasingly sensitive to the statistical structure of the musical system as a result of exposure. (B) Correlations of probe tone ratings with exposure frequencies pre- and post-exposure for trained (Experiment 2) and untrained (Experiment 3) individuals. Error bars reflect between-subject standard errors. (C) Partial correlations of probe tone ratings with exposure frequencies, while partialling out the effect of the melody profile (i.e., event frequencies of tones used in the melody which was played in probe tone trials to obtain ratings). Data from musically trained (Experiment 2) and untrained (Experiment 3) individuals show significant correlations with exposure for post-exposure ratings, but no correlation with exposure for pre-exposure ratings, suggesting that both groups of subjects had no prior knowledge of the musical system, but acquired sensitivity to the statistical structure of the new musical system during their period of exposure.

