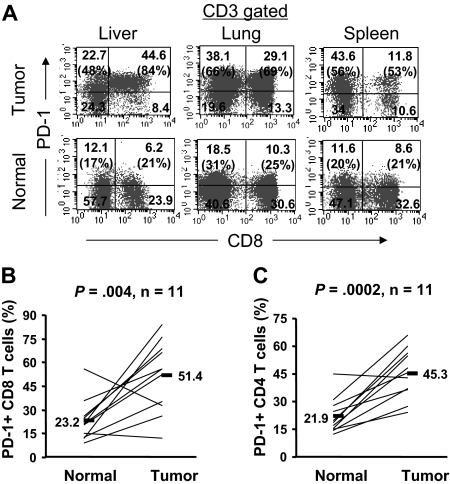
Figure 4.
The frequency of PD-1+ T cells is significantly higher in tumor than adjacent normal tissue. Cryopreserved tumor digests (Tumor) and normal tissue digests (Normal) isolated from the same patients were thawed and immediately stained with CD3, CD8, and PD-1 mAbs. (A) The dot plots were gated on CD3+ lymphocytes. Quadrants were set based on isotype control mAbs. Numbers represent the percentages of T cells in each quadrant and the percentage values represent the fraction of PD-1+ T cells in CD8 T cells (top right quadrant) and CD4 T cells (top left quadrant). The percentage of PD-1+ CD8 T cells per total CD8 T-cells population (B) and PD-1+ CD4 T cells per total CD4 T-cell population (C) in tumors and normal tissues for 11 patients with metastatic melanoma are shown. P value was calculated using the paired t test.

