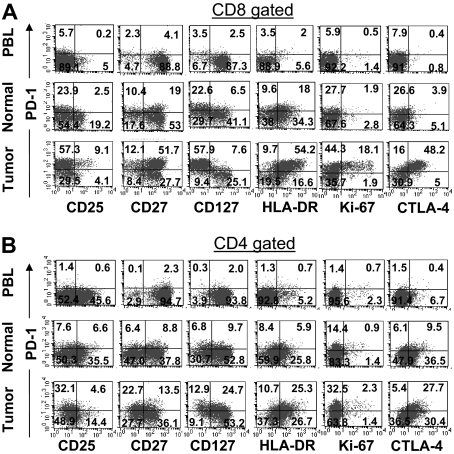
Figure 5.
Phenotypic comparison of CD8 and CD4 T cells infiltrating into tumor, normal tissue, and peripheral blood in the same patient. Cryopreserved digests from a tumor metastasized into lung (Tumor), normal lung tissue (Normal), and peripheral blood lymphocytes (PBL) from the same patient were thawed and immediately stained with CD3, CD8, PD-1 mAbs, and appropriate marker as described in “Flow cytometric analysis.” For CD8 T cells, dot plots were gated on CD3+CD8+ lymphocytes (A) and for CD4 T cells dot plots were gated on CD3+CD8− lymphocytes (B). The numbers represent the percentages of CD8 or CD4 T cells in each quadrant. This is representative of 8 independent experiments from patients with metastatic melanoma lesions and normal tissue isolated from lung (n = 6), liver (n = 1), and spleen (n = 1).

