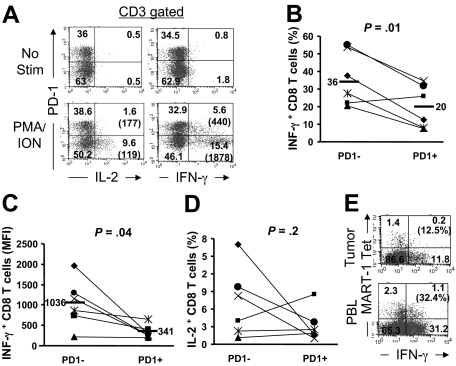
Figure 6.
PD-1 expression on tumor-infiltrating T cells correlates with impaired effector function. Tumor digests and peripheral blood sample from patients with metastatic melanoma were thawed and immediately stimulated with PMA/I for 6 to 8 hours in the presence of monensin. Cells were subsequently stained with anti-CD3, anti-CD8, and anti–PD-1 mAb along with anti–IL-2 and anti–IFN-γ mAbs. (A) Dot plots were gated on CD3+ T cells. The numbers represent the percentages of T cells in each quadrant and the value in parentheses represents the MFI for each quadrant. (B) The percentage of CD3+CD8+ T cells that were IFN-γ+ is depicted for PD-1+ and PD-1− CD8 TILs. (C) The MFI for IFN-γ+ CD3+CD8+ T cells are depicted for PD-1+ and PD-1− CD8 TILs. (D) The percentage of CD3+CD8+ T cells that were IL-2+ is depicted for PD-1+ and PD-1− CD8 TILs for 6 patients. P values are calculated based on the paired t test. (E) IFN-γ production by MART-1 tetramer+ CD8 T cells in tumor digests versus peripheral blood (PBL) from the same patient is shown. The percentage values represent the fraction of MART-1 tetramer+ CD8 T cells that produced IFN-γ.

