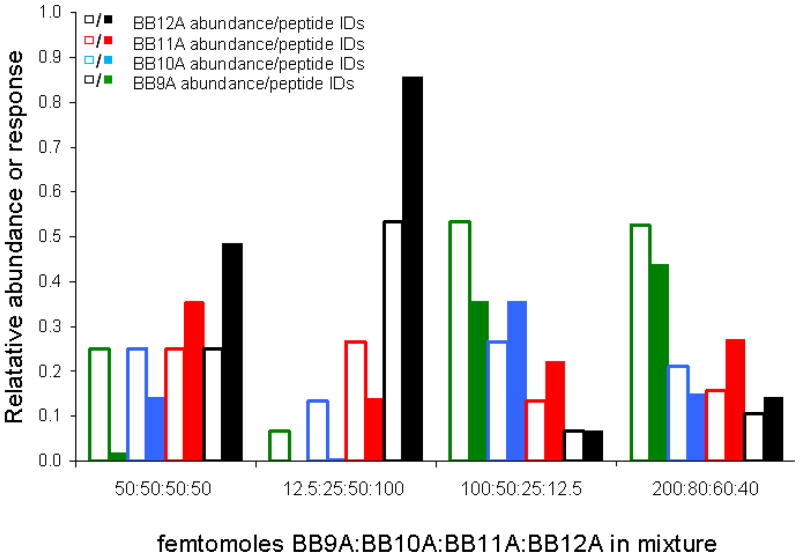
Figure 5.
Peptide identifications from triplicate analyses of peptide library mixtures at differing relative abundance. Hollow bars indicate the solution-phase abundance of each library while solid bars show the fraction of peptide identifications pertaining to particular libraries upon triplicate analysis of each mixture. Abundance ratios are given below each bar graph cluster in femtomoles BB9A:BB10A:BB11A:BB12A, respectively.

