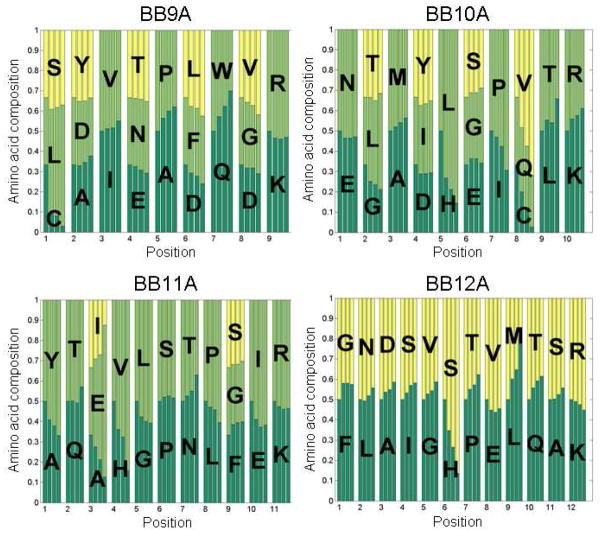
Figure 8.
Illustration of the influence of choice of amino acid on likelihood of peptide identification. A set of four bar graphs is assigned to each site for each library. The leftmost bar represents all peptides at equal abundance in a library. The second bar reflects the preference in detection for cumulative peptide identifications after five replicates. The third bar is based on peptides identified in a randomly selected replicate. The fourth bar represents the amino acid preference observed for peptides identified in all five replicates.

