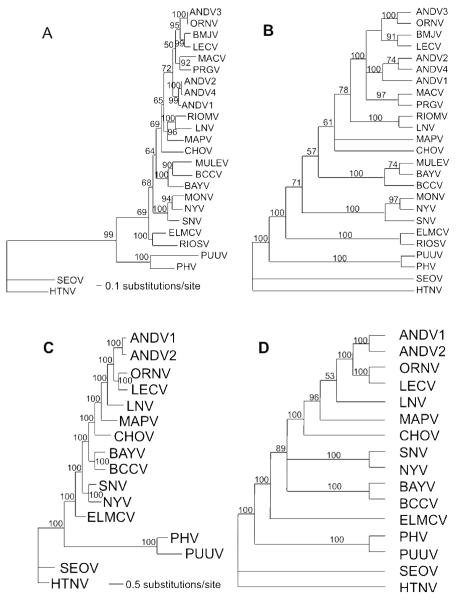
Figure 1.
A. Maximum likelihood analysis of 1302 nt of the S segment of 25 hantaviruses. Tree based on the GTR + G (0.6787) + I(0.3440) model of nucleotide evolution. Numbers associated with node are Bayesian posterior probabilities. Model for Bayesian analyses is the same used for Maximum Likelihood (topologies were identical). B. Single most parsimonious tree based on 675 informative of 1302 total base pairs of the N protein. Characters were weighted based on a rescaled consistency index. Third base positions were analyzed using transversions only. Tree length = 587.794; RCI = 0.5148. Numbers above branches represent percentage of 1000 bootstrap replications supporting each node. Nodes with less than 50% support are collapsed. C. Maximum likelihood analysis of 3465 nt of the M segment of 16 hantaviruses. Tree based on the GTR + G(0.3439) model of nucleotide evolution. Numbers associated with node are Bayesian posterior probabilities. Model for Bayesian analyses is the same used for Maximum Likelihood (topologies were identical). D. Single most parsimonious tree based on 2077 informative of 3465 total base pairs of the GPC gene. Tree length = 6307; CI = 0.4635. Third base positions were analyzed using transversions only.
Numbers above branches represent percentage of 1000 bootstrap replications supporting each node. Nodes with less than 50% support are collapsed.

