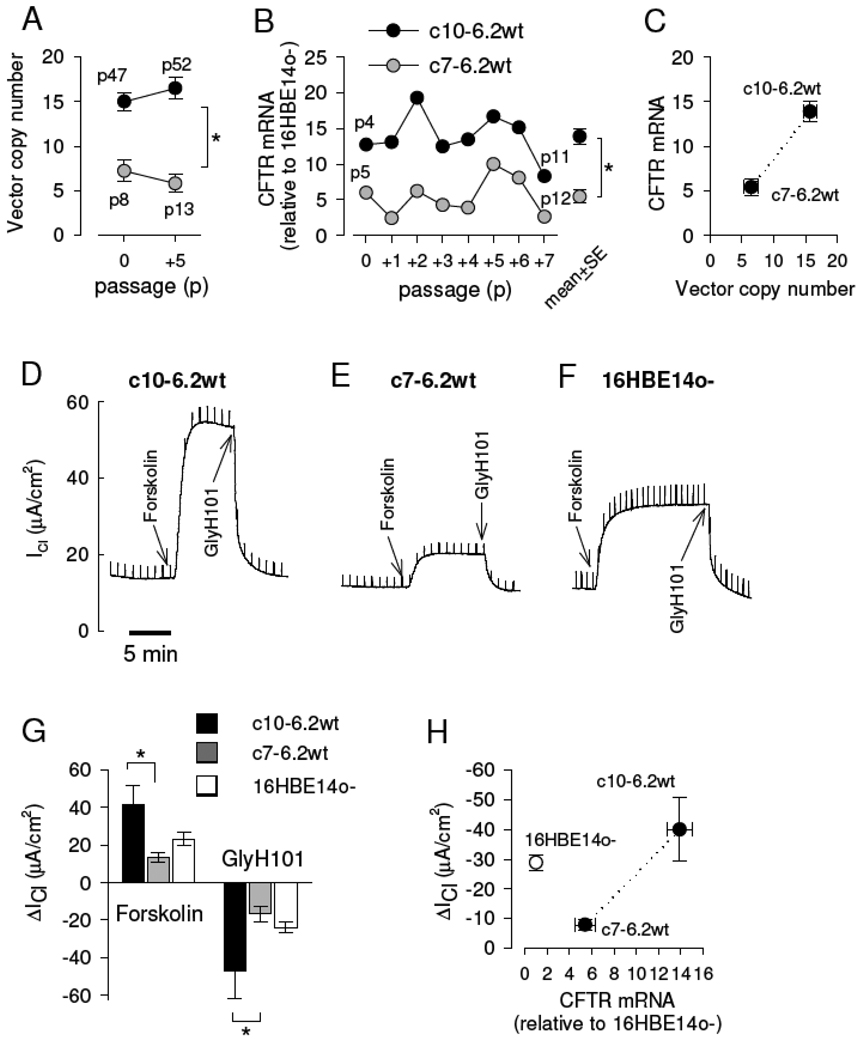
Figure 3. Quantitative assessment of CFTR mRNA expression and cAMP-dependent Cl transport in wtCFTR complemented CFBE41o− clones.
A. The mean number of plasmids per cell (n=3 per bar). Copy number was determined from cells that were 5 passages apart, passage numbers are given next to each symbol. The absolute number of passages (P) as denoted by “(passages after primary isolation).(passages after immortalization).(passages after CFTR transfection)” were p4.77.47 to p4.77.52 for c10-6.2wt, and p4.77.8 to p4.77.13 for c7-6.2wt. Subculturing did not affect the number of vectors per cell; c10-6.2wt expressed significantly higher levels of vector per cell than c7-6.2wt (ANOVA, p=0.005). B. CFTR expression by real-time PCR relative to that measured in the 16HBE14o− cells, relative passage numbers are as indicated. There was no change of expression with passage number (as determined by QRT-PCR analysis of expression level over passage number; c10-6.2wt, p=0.55; c7-6.2wt p=0.68); c10-6.2wt expressed significantly higher levels of mRNA compared to c7-6.2wt (p<0.001, paired t tests). The number of subcultures (P) was p4.77.4 to p4.77.11 for c10-6.2wt and p4.77.5 to p4.77.12 for c7-6.2wt. C. Vector number and CFTR mRNA levels correlated closely (0.9±0.1 mRNA increase per vector). D–F. Transepithelial recordings in the presence of a serosal-to-mucosal Cl gradient. Chloride currents (ICl) were activated by forskolin (20 µM) and inhibited by GlyH101 (20 µM) in c10-6.2wt (D), c7-6.2wt (E), and, for comparison, in 16HBE14o− (F). G. A summary of forskolin-stimulated and GlyH101-blocked chloride currents (ΔICl), n=4–10 experiments per bar; * denotes significant difference (ANOVA). H. The relationship between CFTR expression and function. The correlation between the GlyH101-blocked current and the relative CFTR mRNA expression resulted in a slope of 3.8±0.7 µA/cm2 per unit increase in CFTR mRNA levels, where one unit corresponds to the level of CFTR mRNA in 16HBE14o− cells.

