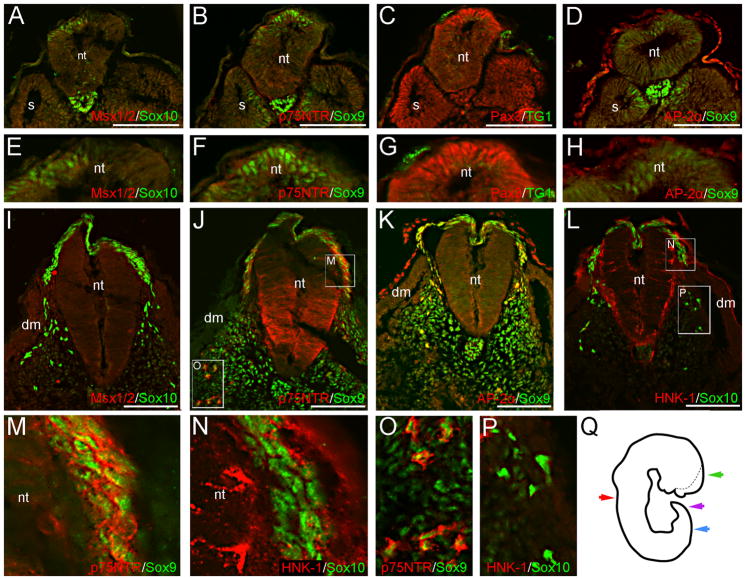
Fig. 1.
NCC markers are expressed in prospective premigratory and migratory NCCs at CS12. Sox10 (A), Sox9 (B, D) and Pax3 (C) signal occur in the dorsal neural tube of caudal trunk sections, prior to the appearance of the hindlimb. These cells likely represent premigratory NCCs. Images in (E–H) are magnifications of the dorsal neural tubes shown in (A–D). We do not observe definitive Msx1/2, p75NTR, or AP-2α signal in premigratory NCCs (A, B, D). The monoclonal antibody TG1 has previously been used to recognize other migratory cells and was thus here tried, but no signal can be associated with premigratory NCCs (C, G). In slightly rostral sections, Sox10 (I, L), Sox9 (J–K), p75NTR (J), and AP-2α (K) are expressed in migratory NCCs situated dorsal, or dorso-lateral to, the neural tube. The majority of AP-2α+ migratory NCCs appear to co-express Sox9 (K). Panels in (M–P) are magnifications of boxed regions shown in (J, L). Although robust p75NTR signal is co-expressed with Sox9 in migratory NCCs adjacent to the neural tube (M), or subadjacent to the dermomyotome (O), this cell population (when identified via Sox10 expression) does not express HNK-1 in similar sections (N, P); migratory NCCs generally appear HNK-1 negative. Image in (Q) is a tracing of the CS12 wholemount, prior to sectioning; the dotted line marks the contra-lateral side of the unfused neural tube. Color-coded arrows represent the axial levels of depicted sections as follows: purple (A–H), blue (I–P), red (Fig. 2), green (Fig. 3). Scale bars in all panels represent 100μm. Note: levels in (A–D) are modified separately from those in (I–L) to optimize signals in different embryonic regions. dm, dermomyotome; nt, neural tube; s, somite.

