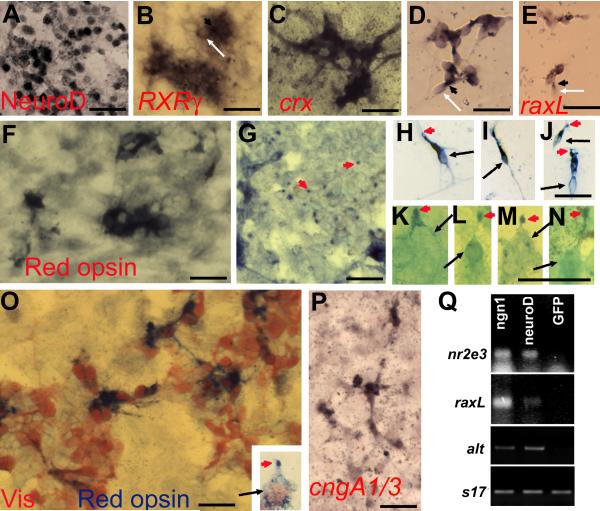
Fig. 3.
Expression of photoreceptor-specific genes in RPE cell cultures infected with RCAS-ngn1. A-E: Induction of transcription factors important for photoreceptor differentiation in ngn1-reprogrammed cultures. A: Immunostaining for NeuroD. B: In situ hybridization for RXRγ mRNA. C,D: In situ hybridization for crx mRNA in primary culture (C) and in re-seeded culture (D). E: In situ hybridization for raxL mRNA. F-K: Expression of phototransduction components in ngn1-reprogrammed cultures. F,G: Anti-red opsin immunostaining of the cell body (F) and dot-like structures at places (of the culture) where more pigmented RPE cells were present (G). H-N: Morphologies of red opsin+ cells in a re-seeded culture under a 40x objective (H-J) or in a primary culture under a 100x objective (K-N). Arrows point to cell bodies. Arrowheads point to cells’ apices decorated by anti-red opsin immunostaining. O: Double-staining with antibodies against visinin (in red) and red opsin (in blue). Inset: A higher magnification view of a double-labeled cell showing its cell body (arrow) and its apex decorated by anti-red opsin (arrowhead). P: In situ hybridization detection of the α-subunits of cone and rod CNG channels (cngA1/3). Q: RT-PCR detection of the expression of two transcription factors (nr2e3 and raxL), one phototransduction component (α-transducin, alt), and a control gene (s17) in cultures expressing RCAS-ngn1, RCAS-neuroD, or RCAS-GFP. Scale bars: 25 μm. A magenta-green copy is available as supplementary data.

