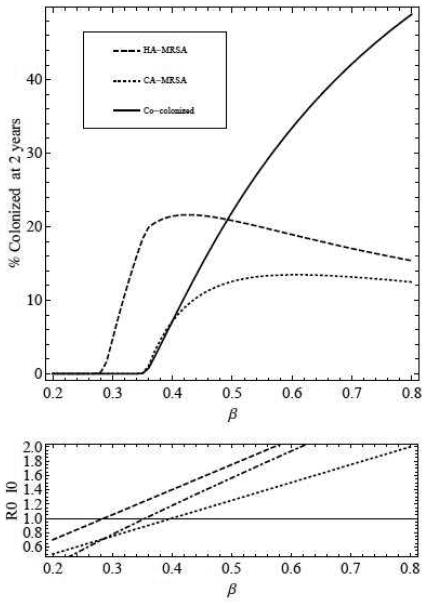
Figure 3.
Top - percentage of patients colonized with HA-MRSA (dashed), CA-MRSA (dotted), and both (solid) after 2 years, as transmission (β = βC = βH = βCH = βHC) is increased. Bottom - (dashed) and (dotted) as transmission is increased. The invasion reproduction number I0Eh is plotted with the dash-dotted line (see equation (2.3) for formula for IH).

