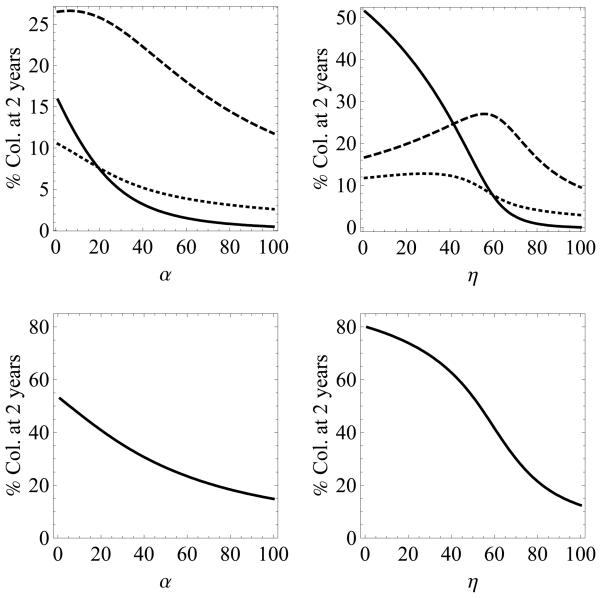
Figure 6.
Top - percentage of patients colonized with HA-MRSA (dashed), CA-MRSA (dotted), and both (solid) after 2 years, versus two interventions: left - decolonization (α) and right - hand-hygiene compliance (η). Bottom - sum of percentages of patients colonized with either or both strains of MRSA. The admission percentages are 100λC = 3%, 100λH = 7%, 100λB = 0%.

