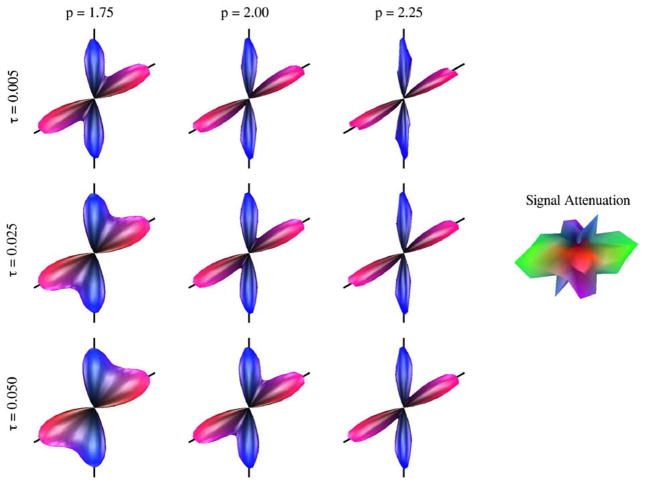
Fig. 6.
Effect of regularization parameters on the deconvolution solution for a 60-directional simulated 60° fiber crossing with SNR=10 and b=3000 s/mm2. FODs shown are the average reconstructions over 100 simulations. All FODs truly have unit mass; here, for easier visual comparison, they are scaled to have the same height. Left: deconvolution results for a range of τ={0.005, 0.025, 0.050} (top to bottom) and p={1.75, 2.00, 2.25} (left to right); black lines in the background provide a 60° reference angle. Right: one realization of the noisy, 60-directional simulated DWI signal attenuation profiles from which the FOD results were generated. Note that the signal attenuation has been rotated 90° relative to the FODs to show the large y-component (green) more clearly. (For interpretation of the references to colour in this figure legend, the reader is referred to the web version of this article.)

