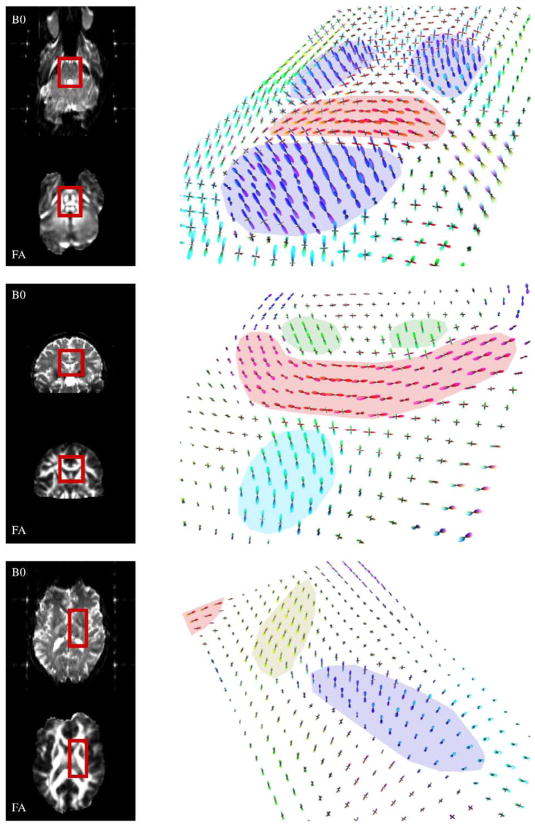
Fig. 8.
Robustness of regularization parameters. Deconvolution results for 3 interesting regions from 3 different subjects, all using the same regularization parameters: τ=0.025 and p=2.25. In each row, the right column contains a perspective view of the FODs in the region of interest, which is also boxed for reference in that subject’s corresponding b0 (top) and FA (bottom) images in the left column. Top row: an axial section at the level of the pons illustrates FODs from the transverse pontine fibers (highlighted red) surrounded by ascending and descending connections to the spinal cord (blue). Middle row: a coronal section illustrating FODs in the corpus callosum (red), in close proximity to fibers in the cingulum bundles (green) and thefornix (cyan) oriented out-of-plane. Bottom row: an axial section at the level of the internal capsule illustrates the thalamo-frontal tract (yellow) in the anterior limb, and corticospinal fibers (blue) in the posterior limb. (For interpretation of the references to colour in this figure legend, the reader is referred to the web version of this article.)

