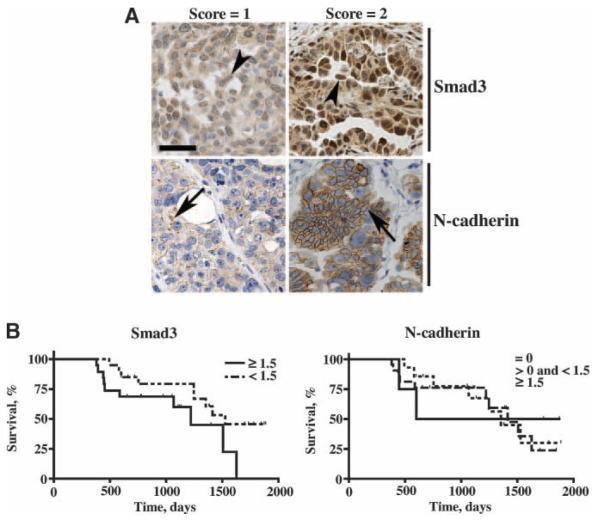
FIGURE 5.
Smad3 and N-cadherin expression in serous cystadenocarcinoma and relationship to survival. A. Brightfield images (20×) showing immunostaining of Smad3 or N-cadherin assigned a score of 1 or 2 in serous cystadenocarcinoma tissue cores counterstained with hematoxylin; bar, 100 μm. B. Survival curves for serous cystadenocarcinoma patients based on average scores for Smad3 (nuclear) and N-cadherin expression. For Smad3, survival curves were plotted for patients exhibiting low (average score < 1.5) and high (average score ≥ 1.5) nuclear expression (P = 0.0513). For N-cadherin, survival curves were plotted for patients with no (average score = 0) expression, low expression (average score < 1.5), and high expression (average score > 1.5; P = 0.9295). Scores for all tissue cores from each patient were averaged and then subjected to Kaplan-Meier estimate and log-rank test.

