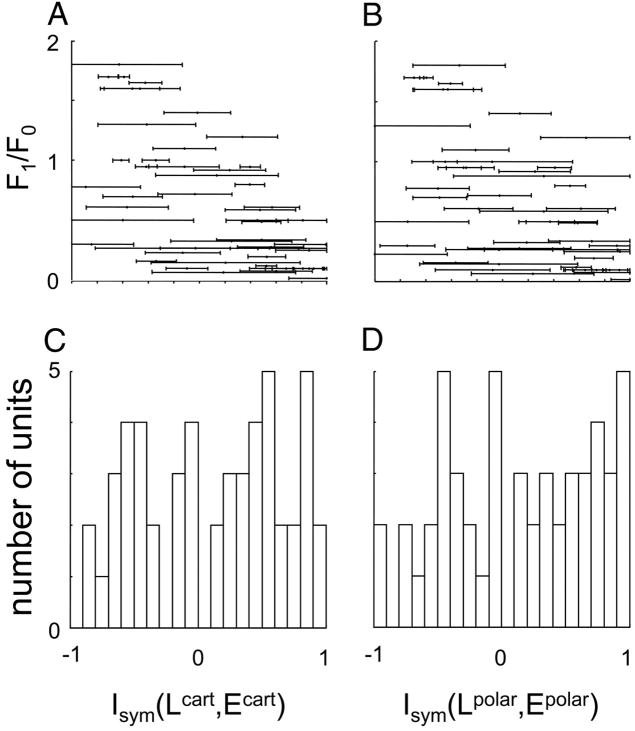
FIG. 11.
Relationship of indices of overall nonlinearity Isym(L, E) (Eq. 5) determined from Cartesian (A) and polar (B) responses to the F1/F0 ratio used to classify cells as simple and complex. For both Cartesian and polar measurements, units with Isym close to 1 tended to have small values (“complex”) of the F1/F0 ratio. C and D: distribution of these indices across the population. The distributions for Cartesian and polar responses are similar.

