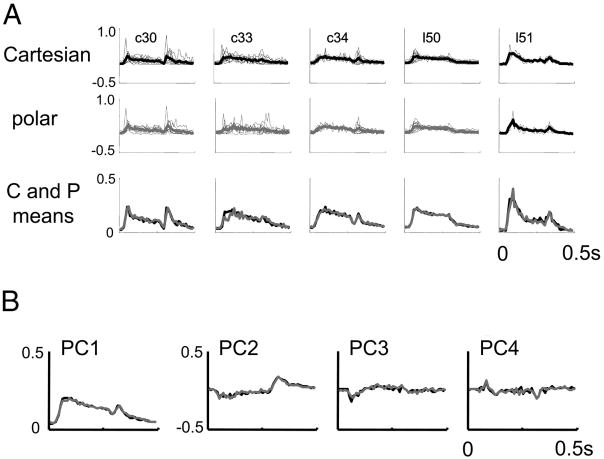
FIG. 13.
Principal components analysis of response dynamics. A: first principal component in response to Cartesian (top row) and polar (bottom row) stimuli. Analyses are carried out separately for each unit and superimposed. Heavy lines in the top 2 rows are the averages within each preparation; the 3rd row compares these averages (Cartesian: black; polar: gray). B: first 4 principal components, averaged across all preparations, displayed as in the 3rd row of A. Although there is much cell-to-cell and preparation-to-preparation variation in the time course of the responses, the time course of the responses elicited by Cartesian and polar stimuli are nearly identical, as seen by the near-superposition of their principal components.

